Introduction
This time, I will try to use Report Rows functionality in Sharperlight.
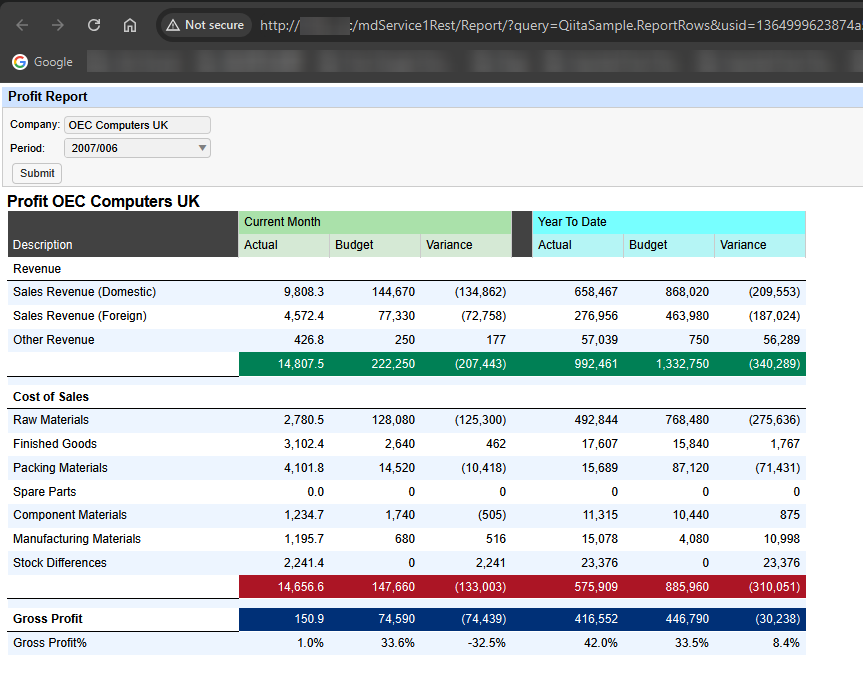
We would be able to see this at the end.
Their explanation about Report Rows is here.
Reporting Rows allows reports to be designed where each row has their own unique list of codes or ranges for a given Row Description. Rows in the Report may are given Line Numbers or Names that can be used in Formulas to calculate value in other parts of the Report.
Designing a Report Rows and a Query
I use SAP Business One as the datasource and designed a classic Profit and Loss style report, but this time I only created the Profit section. Each row in the report is based on different Account Code criteria. There is an expanded section that automatically generates rows based on an Account Code range, as well as various totals, such as Gross Profit.
Definition of Report Rows
To access Report Rows through the Sharperlight Application Menu, select "Report Rows." This will open the Report Rows dialog, where you can view a list of existing Report Rows definitions.
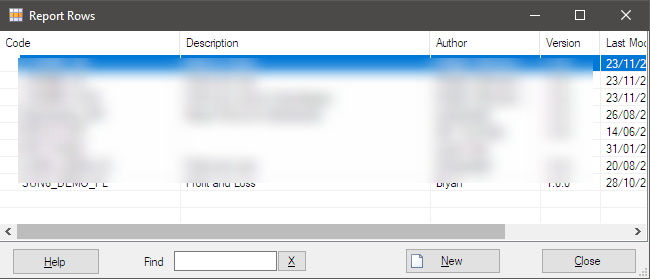
Start with New button to create a new Report Rows.
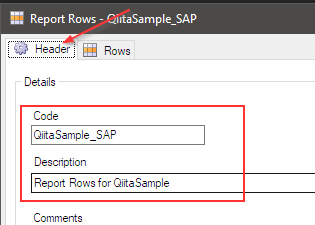
Once the new Report Rows definition dialog open, set its Code and Description on Header tab.
Move to Rows tab
I’ve prepared a sample definition here. Normally, this section would be empty, and you would need to create the definitions from scratch. As you can see, the report is designed using the Report Rows definition. Each row in the report corresponds to a row in the Report Rows definition.

Let's take a look at the definition, row by row.

-
Header row
Set the definition as "Revenue"
SelectHEADERas the Line Category

A line border format is set.

-
Revenue account rows
Set the appropriate descriptions
Specify the account code in a range to the Filter Criteria A

Sales Revenue (Domestic): <<350003..400040, the account code from 350003 to 410040
Sales Revenue (Foreign): <<400041..410030, the account code from 400041 to 410030
Other Revenue: <<410031..450040, the account code from 410031 to 450040 -
Sub Total row for Revenue
Give a name for it asREVENUEso that can be refer from other place
SelectSUBTOTALfor Line Category
Leave blank for Description

Apply formats such as line border, font colour and background colour.

-
A blank row
Place a blank row between Revenue section and Cost of Sales section
SelectBLANKfor Line Category

-
Header row again
Set the definition asCost of Sale
SelectHEADERas the Line Category
A line border format is set -
Cost of Sales account rows
Set the appropriate descriptions
Specify the account code in a range to the Filter Criteria A

Raw Materials: <<500002..500010, the account code from 500002 to 500010
Finished Goods: <<500025..500030, the account code from 500025 to 500030
Packing Materials: <<500045..500050, the account code from 500045 to 500050
Spare Parts: <<500085..500090, the account code from 500085 to 500090
Component Materials: <<500105..500110, the account code from 500105 to 500110
Manufacturing Materials: <<500135..500140, the account code from 500135 to 500140
Stock Differences: <<500160..505000, the account code from 500160 to 505000 -
Sub Total row for Revenue
Give a name for it asCOSso that can be refer from other place
SelectSUBTOTALfor Line Category
Leave blank for Description

Apply formats such as line border, font colour and background colour

-
A blank row
Place a blank row below SUBTOTAL row
SelectBLANKfor Line Category

-
Gross Profit
Add a calculated row so a formula needs to be set into Formula option
The name of rows can be used in the formula: Revenue - Cost of SalesREVENUE - COSSet
TOTALfor Line Category
Give a name for it asGROSSPROFIT

Apply formats such as bold font, line border, font colour and background colour

-
Gross Profit%
Add another calculated row which shows the percentage of the gross profit
Set the formula: Gross Profit / Revenue,
Use the expression DivSafe( ) to prevent an error when the value is divided by zeroDivSafe( GROSSPROFIT,REVENUE )Set
TOTALfor Line Category

Set a special format to display a decimal place for this row only

Designing a query with the Report Rows definition
I am looking into the query which uses the Report Rows definition created above.
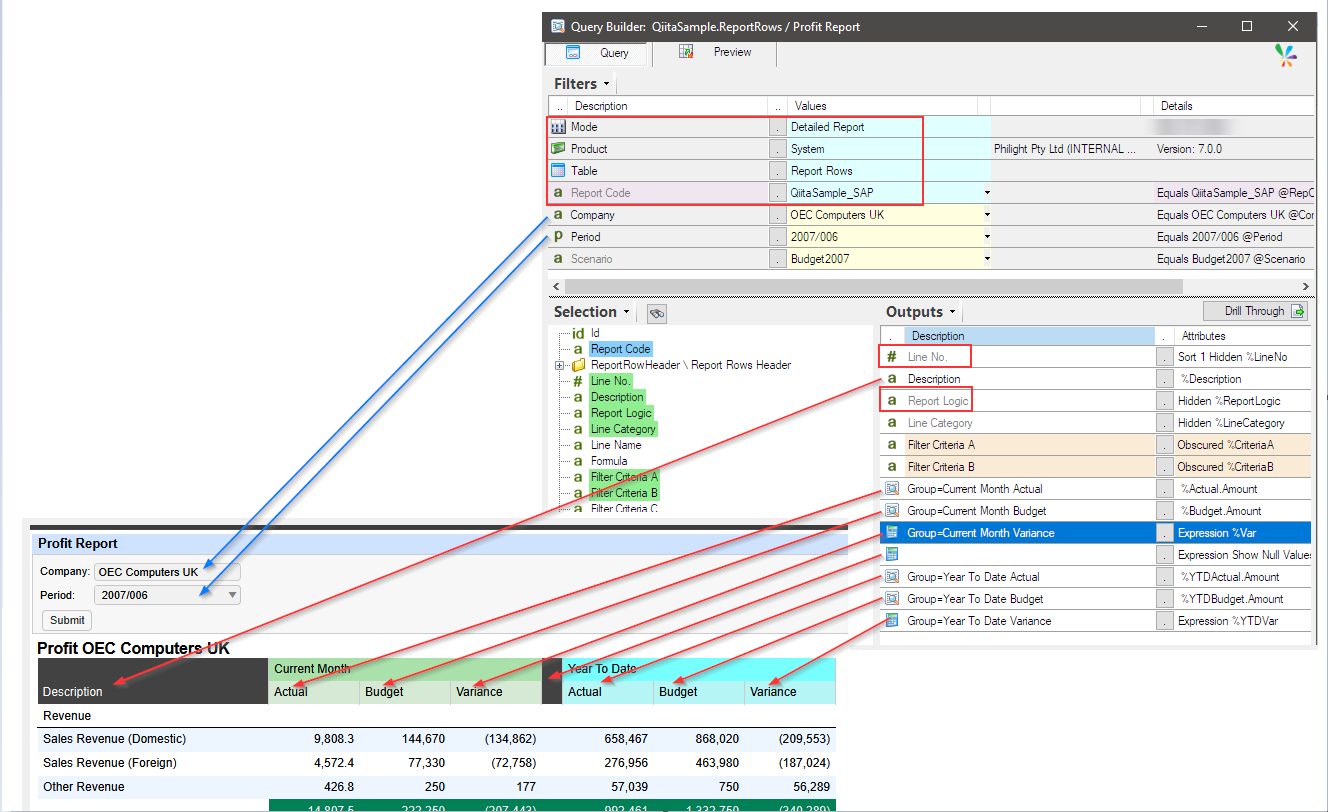
This is a correlation diagram between a query definition and the report that is created by that query.
Filters
Let’s start with the filters.
System is selected as the product to use the Report Rows definition.
The Table must be Report Rows.
The code for the target Report Rows definition is chosen, and all related attributes are displayed in the Selection pane on the left side of the bottom pane of the Query Builder.
As you can see, there are three filters with a yellow background. These prompt filters are manually added to be used in the subqueries for retrieving data from SAP Business One.
They specify a target company, a target period, and a target Budget Scenario.
Prompt Filters mentioned here are not translated into a WHERE clause in the query statement but are used as variables.
The Company and Period filters are shown in the report as prompts. In this example, the company OEC Computers UK is used, and 2007/006 is set as the current period.
Outpus
Line No.
This is chosen to keep the order of rows right. Therefore, the sorting option is set.
Description
This shows the description of each row.
Report Logic
This has all defined attributes applied to the row, and needs as an output item so that sharperlight engine can popultae the report with those attributes.
It is set as hidden item because of not required to be shown.
Line Category
This shows the characteristic of the row defined in the Report Row definition.
This shows the characteristic of the row defined in the Report Row definition. Such as HEADER, TOTAL, SUBTOTAL etc.
It is set as hidden item because of not required to be shown.
Filter Criteria A
This is configured in the Report Row definition, and it is used to get appropriate amount for the each column of the row.
The value such as <<350003..400040 is used by the subqueries defined below to get their amounts.
e.g. In case of the row Sales Revenue (Domestic), its criteria <<350003..400040 is passed to the each subqueries such as Actula and Budget and get the amounts for them.
This is not required to be shown so set as hidden or obscured item.
Filter Criteria B
This is the same as Filter Criteria A, and it is the 2nd criteria.
I didn't use this so it is never used but just set as an output item.
Current Month Actual
This is a subquery to get actual amount in the current month with the Criteria define by the Report Rows.
Current Month Budget
This is a subquery to get budget amount with the Criteria define by the Report Rows.
Current Month Variance
This is an expression, and its formula is =Actual - Budget for Yeat To Date
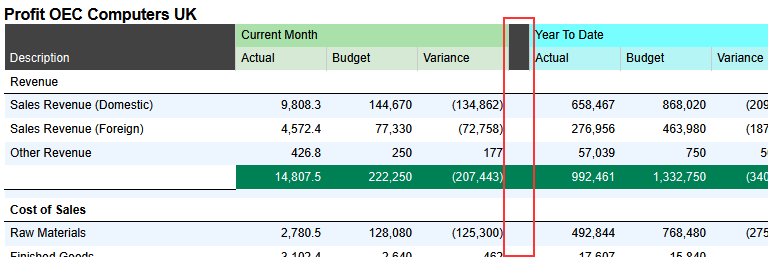
A Blank Column
An expression with "" in Text data type for making a gap between Current Month group and Year To Date group.

Year To Date Actual
This is a subquery to get Year To Date actual amount with the Criteria define by the Report Rows.
Year To Date Budget
This is a subquery to get Year To Date budget amount with the Criteria define by the Report Rows.
Year To Date Variance
This is an expression, and its formula is =Actual - Budget for Yeat To Date
Preview
By clicking Preview button, we can check the result.

Conclusion
This time, I explored the basic usage of the Sharperlight Report Rows function. If you set up such definitions within your company, you can generate a report in the same format simply by entering the target period, date, and other parameters. This functionality seems very useful.
Please see additional post here