RNNは深層学習の中でも結構難しいモデルである。time-step, feature-size, batch-sizeなどhyper-parametersで迷う人もおる。
今日、理解しやすくして天気予報を例にして時系列のデータでRNNを説明したいと思います。
データ
気象庁のDownloadサイトからある県の最近10年の天気を使います。(一回で10年のデータをDownloadできないので、わけってdownloadした方がいい)
データの洗い出し
import pandas as pd

train = pd.read_csv("./older.csv",sep=',')# older.csv は2009年からのデータになります、学習用
test = pd.read_csv("./new.csv",sep=',')# new.csv は2014年からのデータになります、テスト用

train=train.dropna()#データの中でNaN値がありますので、取りぬきます
test=test.dropna()#データの中でNaN値がありますので、取りぬきます
この時点でデータを見てみると
train.head()
| Date | Temp | Total rainfall(mm) | Day time(hour) | Average wind speed(m/s) | Average vapor pressure(hPa) | Average cloud cover | Average local atmospheric pressure(hPa) | |
|---|---|---|---|---|---|---|---|---|
| 0 | 2009/1/1 | 5.1 | 0.0 | 2.3 | 4.9 | 4.9 | 5.3 | 1013.4 |
| 1 | 2009/1/2 | 6.6 | 0.0 | 4.1 | 4.3 | 5.4 | 4.3 | 1018.6 |
| 2 | 2009/1/3 | 6.7 | 0.0 | 3.3 | 2.6 | 5.2 | 4.8 | 1023.2 |
| 3 | 2009/1/4 | 7.1 | 0.0 | 8.4 | 2.1 | 5.6 | 4.0 | 1021.7 |
| 4 | 2009/1/5 | 9.0 | 0.0 | 2.2 | 2.6 | 6.9 | 7.3 | 1019.0 |
plotしていましょう
train.plot(subplots=True, figsize=(18,28), layout=(7,1))
予測データの作り
Dateが温度との関係性が複雑なので、一様使わないと判断します、抜きます。
train=train.drop(["Date"], axis=1)
test=test.drop(["Date"], axis=1)
二日後の温度を予測するモデルをつくりますので、target dataを二日shiftをします
target_names = ['Temp']#予測したい特徴
shift_days = 2
Y_train = train[target_names].shift(-shift_days)
Y_test = test[target_names].shift(-shift_days)
それの結果は、データの最後の二行がNaNなってしまう、それを抜きます。入力もそれに合わせます。
Y_train = Y_train.values[:-shift_days]
Y_test = Y_test.values[:-shift_days]
X_train_np = train.values[0:-shift_days]
X_test_np = test.values[0:-shift_days]
データの正規化
from sklearn.preprocessing import MinMaxScaler

x_scaler = MinMaxScaler()
x_train_scaled = x_scaler.fit_transform(X_train_np)
x_test_scaled = x_scaler.transform(X_test)#テストデータも同じ領域で正規化します(同じ正規器を使う)
num_train = x_train_scaled.shape[0]

y_scaler = MinMaxScaler()
y_train_scaled = y_scaler.fit_transform(Y_train)
y_test_scaled = y_scaler.transform(Y_test)#テストデータも同じ領域で正規化します(同じ正規器を使う)

validation_data = (np.expand_dims(x_test_scaled, axis=0),
                   np.expand_dims(y_test_scaled, axis=0))#評価用
RNN
def batch_generator(batch_size, sequence_length):
    while True:
        x_shape = (batch_size, sequence_length, num_x_signals)
        x_batch = np.zeros(shape=x_shape, dtype=np.float16)

        y_shape = (batch_size, sequence_length, num_y_signals)
        y_batch = np.zeros(shape=y_shape, dtype=np.float16)

        for i in range(batch_size):
            idx = np.random.randint(num_train - sequence_length)

            x_batch[i] = x_train_scaled[idx:idx+sequence_length]
            y_batch[i] = y_train_scaled[idx:idx+sequence_length]

        yield (x_batch, y_batch)
RNNで入力データは(batch, sequence_length, feature)になるので、↑のbatch_generatorを使って、batch_sizeごとにデータを分ける。
## シーケンス長28を使用します。これは、各ランダムシーケンスに1月の観測値が含まれていることを意味します。 1つの時間ステップは1日に対応するので、7つの時間ステップは1週間に対応し、7×4は1月に対応する。

batch_size = 32
sequence_length =  7 * 4
generator = batch_generator(batch_size=batch_size,
                            sequence_length=sequence_length)
RNN(GRU)作成
シーケンスの各タイムステップごとに128個の出力があるGated Recurrent Unit(GRU)のネットワークを追加します。The GRU が128個のoutputです、しかし私たちが予測したいのは温度だけなので、denseを使って1outputにまとめます. 出力データは[0,1]の間で正規化していますので、Sigmoidを使って予測範囲も[0,1]にしたほうが計算が下がります、reluとかはもつかいます、しかしtanhは使えないので(なぜ)気をつけてください(正規化の範囲が[0,1]なので)
from keras.models import Sequential
from keras.layers import Input, Dense, GRU, Embedding
from keras.optimizers import RMSprop


model = Sequential()
model.add(GRU(units=128,
              return_sequences=True,
              input_shape=(None, num_x_signals,)))
model.add(Dense(num_y_signals, activation='sigmoid'))
model.compile(loss="mse", optimizer='adam')

model.summary()
Layer (type)                 Output Shape              Param #
=================================================================
gru_1 (GRU)                  (None, None, 128)         52224
_________________________________________________________________
dense_1 (Dense)              (None, None, 1)           129
=================================================================
Total params: 52,353
Trainable params: 52,353
Non-trainable params: 0
_________________________________________________________________
model.fit_generator(generator=generator,
                    epochs=5,
                    steps_per_epoch=100,
                    validation_data=validation_data)
天気予報
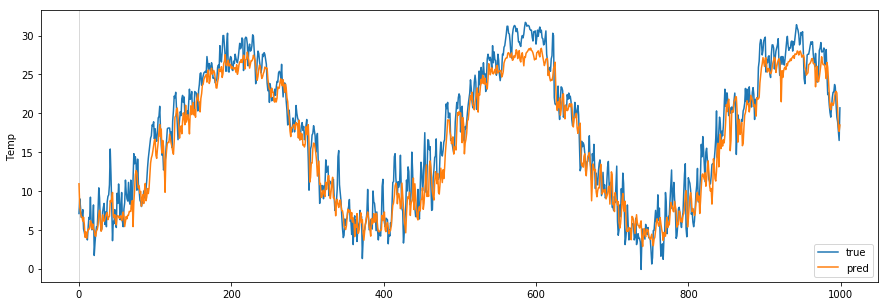
最後に学習したモデルを使って、予測してみましょう。
# This code credit goes to https://github.com/Hvass-Labs
def plot_comparison(start_idx, length=100, train=True):
    """
    Plot the predicted and true output-signals.

    :param start_idx: Start-index for the time-series.
    :param length: Sequence-length to process and plot.
    :param train: Boolean whether to use training- or test-set.
    """

    if train:
        # Use training-data.
        x = x_train_scaled
        y_true = Y_train
    else:
        # Use test-data.
        x = x_test_scaled
        y_true = Y_test

    # End-index for the sequences.
    end_idx = start_idx + length

    # Select the sequences from the given start-index and
    # of the given length.
    x = x[start_idx:end_idx]
    y_true = y_true[start_idx:end_idx]

    # Input-signals for the model.
    x = np.expand_dims(x, axis=0)

    # Use the model to predict the output-signals.
    y_pred = model.predict(x)

    # The output of the model is between 0 and 1.
    # Do an inverse map to get it back to the scale
    # of the original data-set.
    y_pred_rescaled = y_scaler.inverse_transform(y_pred[0])

    # For each output-signal.
    for signal in range(len(target_names)):
        # Get the output-signal predicted by the model.
        signal_pred = y_pred_rescaled[:, signal]

        # Get the true output-signal from the data-set.
        signal_true = y_true[:, signal]

        # Make the plotting-canvas bigger.
        plt.figure(figsize=(15,5))

        # Plot and compare the two signals.
        plt.plot(signal_true, label='true')
        plt.plot(signal_pred, label='pred')

        # Plot grey box for warmup-period.
        p = plt.axvspan(0, 1, facecolor='black', alpha=0.15)

        # Plot labels etc.
        plt.ylabel(target_names[signal])
        plt.legend()
        plt.show()
学習で使ったデータで予測します
plot_comparison(start_idx=1, length=1000, train=True)
テストデータで予測します
plot_comparison(start_idx=1, length=1000, train=False)


