エラーメッセージ
Jupyter Notebook上でグラフ表示をするときに以下の警告が出たので対処法メモ
UserWarning: FigureCanvasAgg is non-interactive, and thus cannot be shown
plt.show
エラーが出た時のコード
KaggleのTitanic問題のコードをサンプルとして使用
import pandas as pd
import matplotlib as mpl
import matplotlib.pyplot as plt
import seaborn as sns

train_data = pd.read_csv('data/titanic/train.csv')

#~~~~~~~~~~ 中略 ~~~~~~~~~~~~~~

#生存率グラフ
plt.figure(figsize=(3,2))
sns.countplot(x=train_data['Sex'], hue=train_data['Survived'].astype(str))
plt.show()
解決したコード
「%matplotlib inline」を指定して解決
%matplotlib inline

import pandas as pd
import numpy as np
import matplotlib as mpl
import matplotlib.pyplot as plt
import seaborn as sns

train_data = pd.read_csv('data/titanic/train.csv')

#~~~~~~~~~~ 中略 ~~~~~~~~~~~~~~

#生存率グラフ
plt.figure(figsize=(3,2))
sns.countplot(x=train_data['Sex'], hue=train_data['Survived'].astype(str))
plt.show()
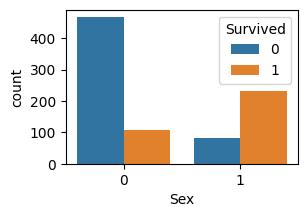
グラフも想定通り表示されたのでめでたし!
原因
Matplotlibの出力が非インタラクティブなキャンバス (FigureCanvasAgg) に設定されていたため、図を表示することができない旨の警告が出ていた。
おわりに
どのタイミングでFigureCanvasAggがセットされてしまったのかは軽く調べた感じ分からなかった。
後で調べるの忘れないためにもこの記事を備忘録とする。
怪しいのは記載のコードには載ってないがydata_profilingをimportしたことかな。。
これを調べるのは宿題ということで。