ことの発端
リモート授業は楽なんですが、課題が多い...。だから、あんまり一つの課題に時間をかけたくないんですわ。
大学の課題「人口動態の数理モデルを作れ(数式で表せ)」
私「めんどくさいなぁ....。ゆけ、R!」
...ってな感じで、Rを使って人口動態の近似曲線を導出してみました。めっちゃ簡単です。
環境
macOS Catalina 10.15.4
R Studio (Version 1.2.5042)
あ、あと、tidyverseを使うので入れといてください。
用意したデータ
名古屋市の月毎の人口動態を扱います。ありがたいことに名古屋市の人口動態は.csvでダウンロードできます。やったね!
ま、ダウンロードしてみるといろいろなデータが含まれているので、市の人口のデータだけを抽出して、下のように新たな.csvを作ります。nは2012年1月からの月数です。
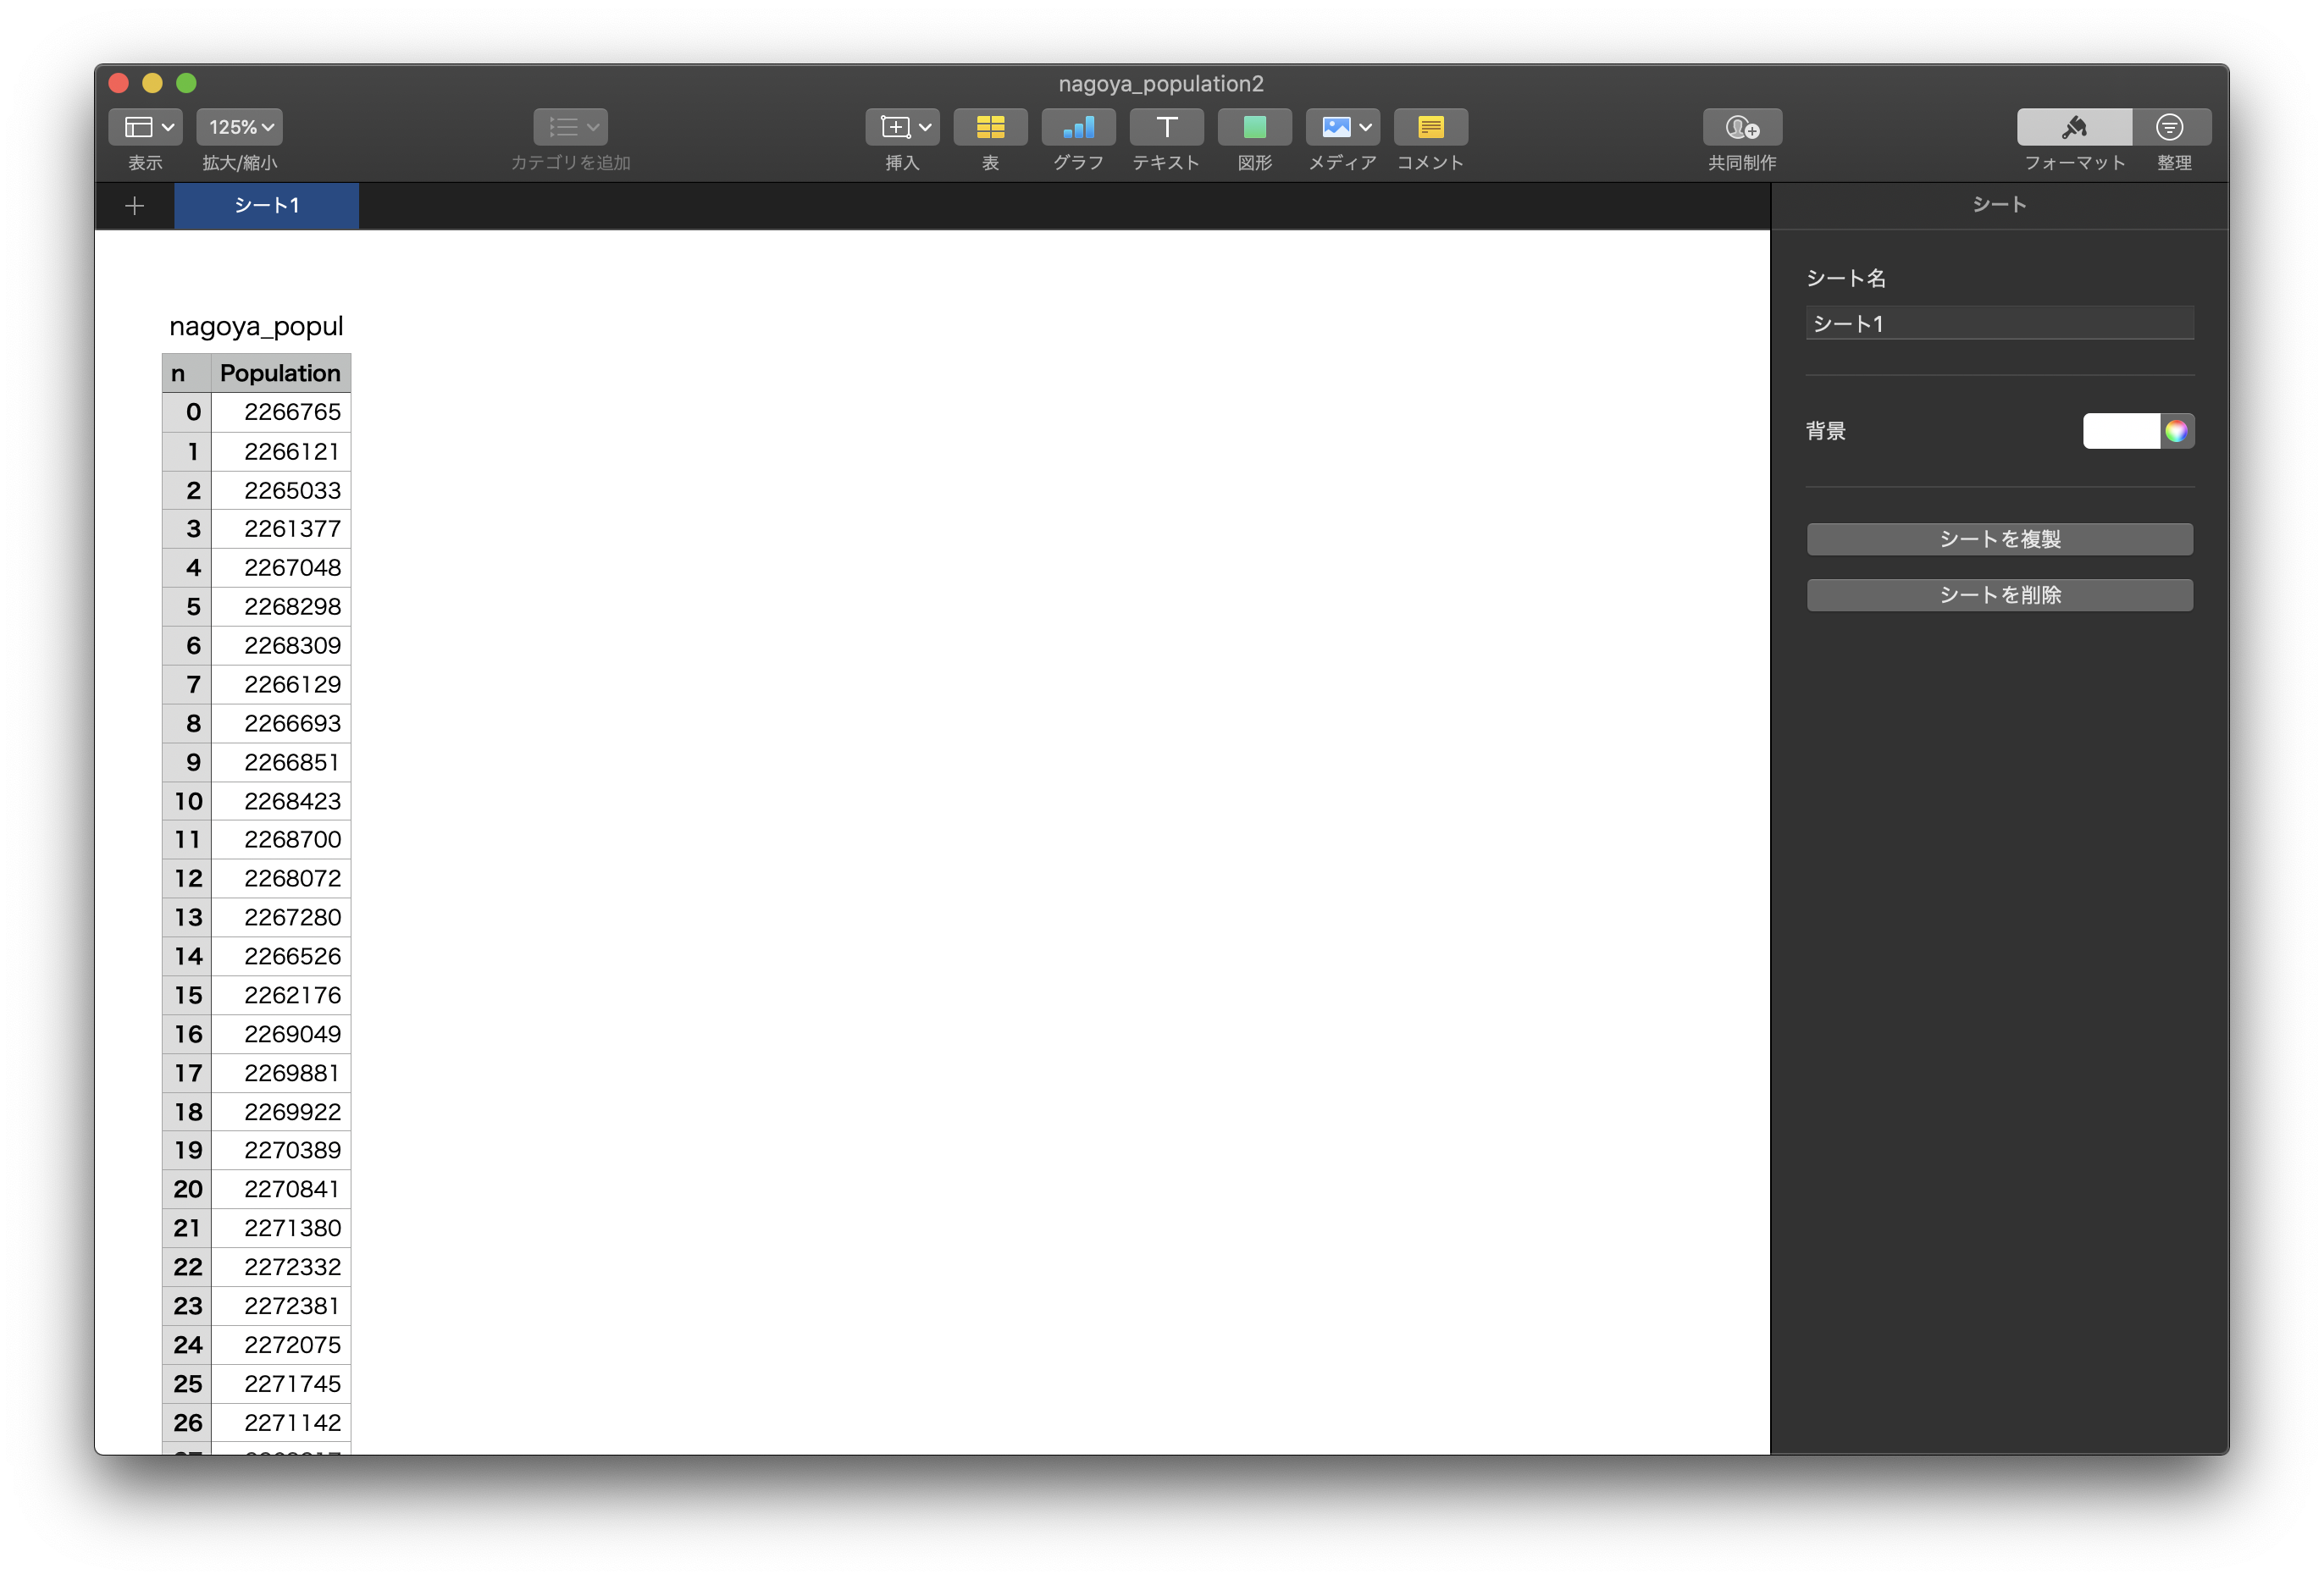
この.csvを使っていきます。
試しにグラフにしてみる
make_graph.r
library(tidyverse)
filename <- file.choose()
data <- read.csv(filename,header=T)
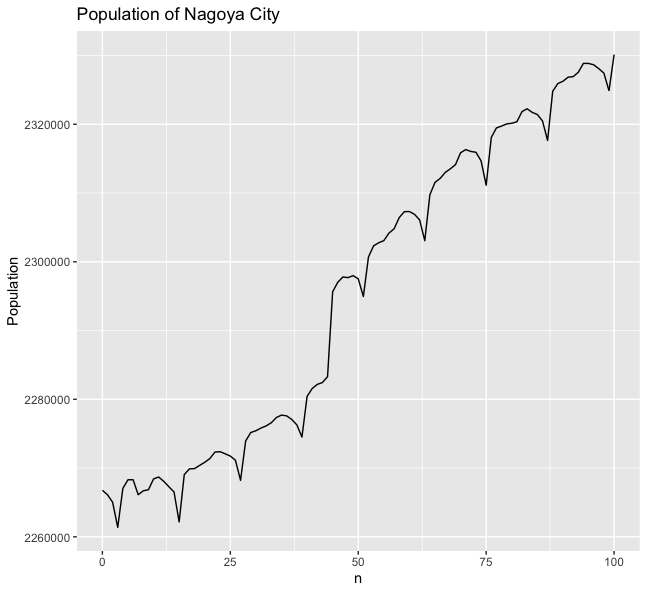
graph = ggplot(data, aes(x=n, y=Population)) + geom_line(col="black") + labs(title="Population of Nagoya City")
plot(graph)
動かす時は、R StudioのSourceをクリックして、そこからさっきの.csvを選択してくださいな。
こんな感じにグラフができます。
近似曲線を出してみる
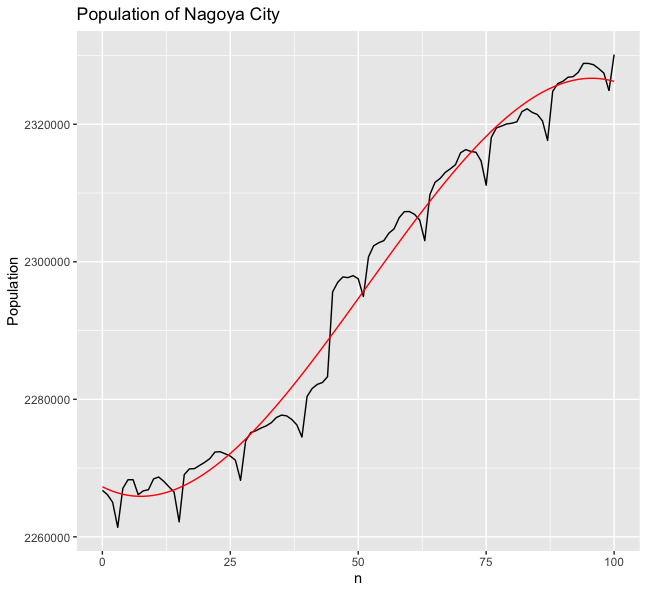
さて、本題です。さっきのグラフから、「まぁ、3次関数にしておけばいい感じになるかな」と思ったので、3次曲線で近似していきます。
approximateline.r
library(tidyverse)
filename <- file.choose()
data <- read.csv(filename,header=T)
graph = ggplot(data, aes(x=n, y=Population)) + geom_line(col="black") + labs(title="Population of Nagoya City")
x = data[,1]
y = data[,2]
approximated = nls(y ~ a * x^3 + b * x^2 + c * x + d, start=c(a=0, b=0, c=0, d=0))
summary(approximated)
predict.c = predict(approximated)
approximate = data.frame(predict.c)
approximate$num = data[,1]
coef = coefficients(approximated)
approximateline = geom_line(aes(approximate$num, approximate$predict.c), col="red")
plot(graph + approximateline)
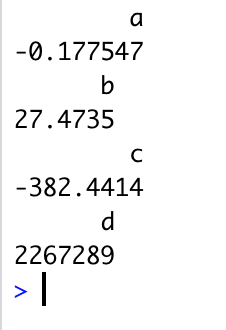
print(coef[1])
print(coef[2])
print(coef[3])
print(coef[4])
コンソールには下のように係数(a,b,c,dの値)が出力されます。
簡単でしたね。