はじめに
このノートブックでは、KerasNLPライブラリを使用して、Twitterのツイートが本当に災害に関するものかどうかを分類するモデルを構築します。特に、事前にトレーニングされたDistilBERTモデル(※1)を使用してツイートのテキストを処理し、分類するモデルをトレーニングし、最終的な提出ファイルを生成していきます。
- 以下のステップを順に説明していきます:
- 災害ツイートのデータセットを読み込む
- データセットの探索
- データの前処理
- KerasNLPからDistilBERTモデルを読み込む
- モデルのトレーニング(BERTのファインチューニング)
- 提出ファイルの生成
必要なライブラリのインストール / TensorFlowを使用したKeras Coreの設定
!pip install keras-core --upgrade
!pip install -q keras-nlp --upgrade
import os
os.environ['KERAS_BACKEND'] = 'tensorflow'
データセットのロード
次に、災害ツイートのデータセットを読み込みます。train.csvには訓練用データ、test.csvにはテスト用データが含まれています。
import pandas as pd

df_train = pd.read_csv("/kaggle/input/nlp-getting-started/train.csv")
df_test = pd.read_csv("/kaggle/input/nlp-getting-started/test.csv")

print('Training Set Shape = {}'.format(df_train.shape))
print('Test Set Shape = {}'.format(df_test.shape))

df_train.head()
データの探索
データの基本的な統計を確認し、各ツイートのテキスト長を調べていきましょう。
df_train["length"] = df_train["text"].apply(lambda x: len(x))
df_test["length"] = df_test["text"].apply(lambda x: len(x))

print("Train Length Stat")
print(df_train["length"].describe())

print("Test Length Stat")
print(df_test["length"].describe())
データの前処理
訓練データをトレーニングセットとバリデーションセットに分割し、KerasNLPモデルにデータを読み込ませるように前処理を行います。
from sklearn.model_selection import train_test_split

X = df_train["text"]
y = df_train["target"]

X_train, X_val, y_train, y_val = train_test_split(X, y, test_size=0.2, random_state=42)
X_test = df_test["text"]
DistilBERTモデルの読み込み
それでは、KerasNLP(※2)の事前学習済みモデルDistilBERTを使用して、テキスト分類タスクに取り組んでいきます。このモデルには、テキストの前処理を行うプリプロセッサ層が含まれています。
import keras_nlp

# DistilBERTモデルの読み込み
preset = "distil_bert_base_en_uncased"

preprocessor = keras_nlp.models.DistilBertPreprocessor.from_preset(preset, sequence_length=160)
classifier = keras_nlp.models.DistilBertClassifier.from_preset(preset, preprocessor=preprocessor, num_classes=2)

classifier.summary()
モデルのコンパイルとトレーニング
モデルをコンパイルし、トレーニングします。最初に学習率の低いAdamオプティマイザを使用し、損失関数としてSparseCategoricalCrossentropyを設定します。
# モデルのコンパイル
classifier.compile(
    loss=keras.losses.SparseCategoricalCrossentropy(from_logits=True),
    optimizer=keras.optimizers.Adam(1e-5),
    metrics=["accuracy"]
)

# モデルのトレーニング
history = classifier.fit(
    x=X_train,
    y=y_train,
    batch_size=32,
    epochs=2,
    validation_data=(X_val, y_val)
)
混同行列の表示
訓練セットおよびバリデーションセットに対して予測を行い、混同行列とF1スコアを表示します。
from sklearn.metrics import confusion_matrix, ConfusionMatrixDisplay  # 混同行列の計算と可視化に必要なライブラリ
import numpy as np  # 配列操作を簡単にするためのライブラリ
import matplotlib.pyplot as plt  # グラフやプロットを描画するためのライブラリ

# 混同行列とF1スコアを表示する関数
def displayConfusionMatrix(y_true, y_pred, dataset):
    # 混同行列の表示を作成
    disp = ConfusionMatrixDisplay.from_predictions(
        y_true,  # 実際のラベル
        np.argmax(y_pred, axis=1),  # 予測結果をラベルに変換(モデルの出力を最大値で分類)
        display_labels=["Not Disaster", "Disaster"],  # ラベル名を指定(災害か否か)
        cmap=plt.cm.Blues  # 混同行列を青色のグラデーションで表示
    )

    # 混同行列の要素(TN, FP, FN, TP)を取得
    tn, fp, fn, tp = confusion_matrix(y_true, np.argmax(y_pred, axis=1)).ravel()

    # F1スコアを計算
    f1_score = tp / (tp + ((fn + fp) / 2))

    # グラフのタイトルにデータセット名とF1スコアを表示
    disp.ax_.set_title(f"Confusion Matrix on {dataset} Dataset -- F1 Score: {f1_score.round(2)}")
    plt.show()  # グラフを表示

# 訓練データに対して予測を行い、混同行列とF1スコアを表示
y_pred_train = classifier.predict(X_train)
displayConfusionMatrix(y_train, y_pred_train, "Training")

# バリデーションデータに対して予測を行い、混同行列とF1スコアを表示
y_pred_val = classifier.predict(X_val)
displayConfusionMatrix(y_val, y_pred_val, "Validation")
提出ファイルの生成
テストデータに対して予測を行い、提出用のsubmission.csvファイルを作成します。
sample_submission = pd.read_csv("/kaggle/input/nlp-getting-started/sample_submission.csv")
sample_submission["target"] = np.argmax(classifier.predict(X_test), axis=1)
sample_submission.to_csv("submission.csv", index=False)
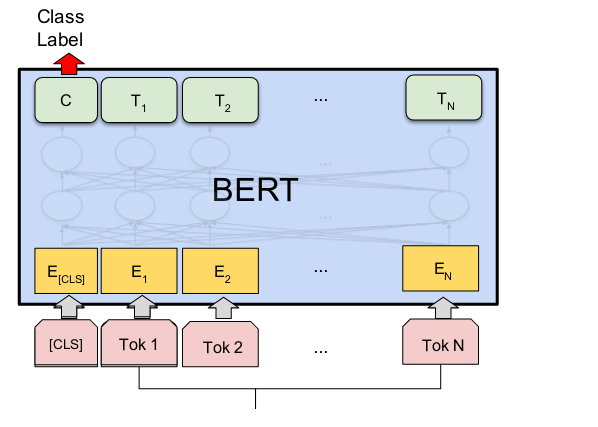
※ そもそも「DistilBERTモデル」とは?
DistilBERTは、BERTモデルを小型化・高速化したバージョンで、BERTの約60%の速度向上と40%のサイズ削減を実現しながら、97%の性能を維持しています。
BERTは「Bidirectional Encoder Representations from Transformers」の略で、自然言語処理(NLP)において非常に成功した深層学習モデルです。BERTはTransformerエンコーダーアーキテクチャを使用しており、テキスト内の各単語(トークン)を前後の文脈とともに処理します。このため、双方向的な文脈理解が可能です。
BERTモデルは通常、大規模なテキストコーパスで事前トレーニングされ、その後特定のタスクに合わせてファインチューニングされます。これにより、非常に高精度な言語モデルを作成することが可能です。
DistilBERTは、BERTのサイズを40%削減した軽量版です。知識蒸留という手法を用いて、BERTの97%の言語理解能力を維持しながら、60%高速化されています。このモデルは、リソースが限られた環境でもBERTのパフォーマンスを活用できるように設計されています。
混同行列とは:
混同行列は、モデルの予測結果と実際のラベルの組み合わせを視覚化するための表になります。
- True Positive (TP): 災害ツイートを正しく災害として予測。
- False Positive (FP): 災害でないツイートを誤って災害として予測。
- True Negative (TN): 災害でないツイートを正しく非災害として予測。
- False Negative (FN): 災害ツイートを誤って非災害として予測。
F1スコアとは:
F1スコアは、精度(Precision)と再現率(Recall)のバランスを測る指標で、災害ツイートの分類精度を評価します。