はじめに
D3.jsを勉強し始めたのですが、まだまだv4に対応した日本語の書籍や情報などは少ないようです(2017年5月現在)。
シンプルな散布図を作ろうとしたのですが、ちょうどいいサンプルコードが見つからなかったので自分が作ったものを載せてみます。
目標
- 散布図(Scatter Plot)を作成する。
- データの追加と削除を行う。
- 軸をデータに合わせて自動調整する。
- プロットと軸の状態はtransitionで遷移させる。
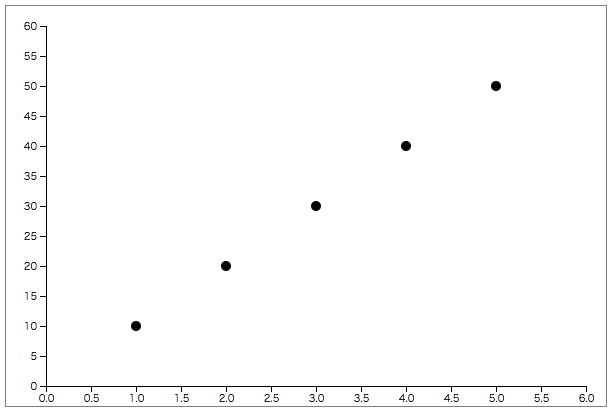
初期状態
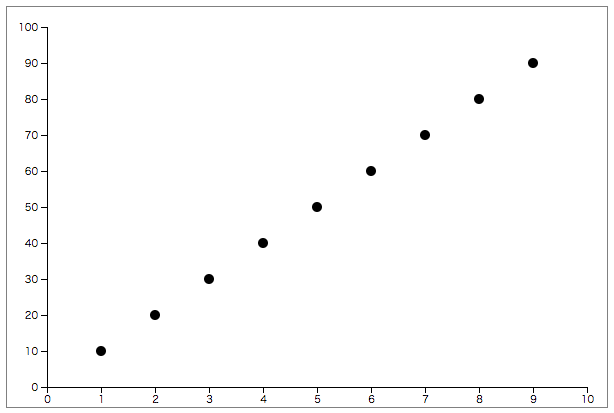
データを追加した状態
サンプルコード
デモページ
htmlファイルをローカルに置いても動作します。
以下の問題がありますが、コードをシンプルにするために対策はしていません。
- データの追加時にも、削除のtransitionの待ち時間が発生します。
- 描画中にデータの追加・削除を行うと、プロットが正常に描画されません。
scatter-plot.html
<!DOCTYPE html>
<html>

<head>
	<meta charset="utf-8">
	<title>Scatter Plot</title>

	<style>
	svg {
		border: solid 1px gray;
	}
	</style>

	<script src="https://d3js.org/d3.v4.min.js"></script>
</head>

<body>
	<!-- グラフを描画するsvg -->
	<svg></svg>

	<div>
		<button onclick="addData()">追加</button>
		<button onclick="deleteData()">削除</button>
	</div>

	<script>
	// ==================== メインルーチン ==================== //
	var data = [
		{ x: 1, y: 10 },
		{ x: 2, y: 20 },
		{ x: 3, y: 30 },
		{ x: 4, y: 40 },
		{ x: 5, y: 50 }

	];

	var svgWidth = 600; // svg要素の幅
	var svgHeight = 400; // svg要素の高さ
	var margin = {top: 20, right: 20, bottom: 20, left: 40}; // マージン
	var width = svgWidth - margin.left - margin.right; // グラフエリアの幅
	var height = svgHeight - margin.top - margin.bottom; // グラフエリアの高さ
	var t1, t2, t3; // transition用変数(t1:プロット削除, t2:スケール遷移, t3:プロット追加)
	var scale = {}; // スケール用変数

	// ----- SVG要素の設定 ----- //
	var svg = d3.select("svg")
		.attr('width', svgWidth)
		.attr('height', svgHeight);

	// ----- グラフエリアの設定 ----- //
	var g = svg.append('g')
		.attr('transform', translate(margin.left, margin.top));

	// ----- 初期データの表示 ----- //
	setScale();
	initializeAxis();
	initializePlot();

	// ==================== 関数定義 ==================== //

	// ----- プロットの初期設定 ----- //
	function initializePlot() {
		var plot = g.selectAll('circle')
			.data(data)
			.enter()
			.append('circle')
			.attr('cx', function(d) { return scale.x(d.x) })
			.attr('cy', function(d) { return scale.y(d.y) })
			.attr('r', 5);
	}

	// ----- プロットのアップデート ----- //
	function updatePlot() {
		// データのバインド
		var plot = g.selectAll('circle')
			.data(data);

		// 削除されたデータのプロットを削除
		plot.exit()
			.transition(t1)
			.attr('r', 0)
			.remove();

		// 既存のデータのプロットはスケールの変更に合わせて位置を変更
		plot.transition(t2)
			.attr('cx', function(d) { return scale.x(d.x) })
			.attr('cy', function(d) { return scale.y(d.y) });

		// 新規データのプロットを追加
		plot.enter()
			.append('circle')
			.attr('cx', function(d) { return scale.x(d.x) })
			.attr('cy', function(d) { return scale.y(d.y) })
			.attr('r', 0)
			.transition(t3)
			.attr('r', 5);
	}

	// ----- スケールの設定 ----- //
	function setScale() {
		// X軸
		var xRangeMin = 0;
		var xRangeMax = d3.max(data, function(d) { return d.x; }) + 1;

		scale.x = d3.scaleLinear()
			.domain([xRangeMin, xRangeMax])
			.range([0, width]);

		// Y軸
		var yRangeMin = 0;
		var yRangeMax = d3.max(data, function(d) { return d.y; }) + 10;

		scale.y = d3.scaleLinear()
			.domain([yRangeMin, yRangeMax])
			.range([height, 0]);
	}

	// ----- 軸の初期設定 ----- //
	function initializeAxis() {
		// X軸
		svg.append('g')
			.attr('class', "x_axis")
			.attr('transform', translate(margin.left, height + margin.top))
			.call(d3.axisBottom(scale.x));

		// Y軸
		svg.append('g')
			.attr('class', "y_axis")
			.attr('transform', translate(margin.left, margin.top))
			.call(d3.axisLeft(scale.y));
	}

	// ----- 軸の再設定 ----- //
	function resetAxis() {
		// X軸
		svg.select(".x_axis")
			.transition(t2)
			.call(d3.axisBottom(scale.x));

		// Y軸
		svg.select(".y_axis")
			.transition(t2)
			.call(d3.axisLeft(scale.y));
	}

	// ----- transitionの設定(delayで調整) ----- //
	function setTransition() {
		t1 = d3.transition()
			.duration(500);

		t2 = d3.transition()
			.duration(1000)
			.delay(500);

		t3 = d3.transition()
			.duration(500)
			.delay(1000);
	}
/*
	// ----- transitionの設定(チェーンで調整) ----- //
	function setTransition() {
		t1 = d3.transition()
			.duration(500);

		t2 = t1.transition()
			.duration(1000);

		t3 = t2.transition()
			.duration(500);
	}
*/
	// ----- translate用の文字列を作成 ----- //
	function translate(x, y) {
		return 'translate(' + x + ',' + y + ')';
	}

	// ----- データの追加 ----- //
	function addData() {
		if (data.length >= 10) {
			return;
		}

		data.push({
			x: data.length + 1,
			y: (data.length + 1) * 10
		});

		setTransition();
		setScale();
		resetAxis();
		updatePlot();
	}

	// ----- データの削除 ----- //
	function deleteData() {
		if (data.length == 0) {
			return;
		}

		data.pop();

		setTransition();
		setScale();
		resetAxis();
		updatePlot();
	}
	</script>
</body>

</html>
参考
D3 Tips and Tricks v4.x
GitHub - d3/d3-transition:Animated transitions for D3 selections.
General Update Pattern, III
Chained Transitions