はじめに
PythonのMatplotlibでグラフを作成する時に、1つ1つデータフレームから値を取得して何百もあるリスト分全てのグラフを作成しようとするとキリがないので一度にできる方法を試作しました。
方法
方法は以下の通りです。
① データフレームを読み込む
① ‘リストが重複している場合は新たなデータフレームとしてまとめておく(重複の削除)
② Forループを使って順番にグラフを作成していく
コード
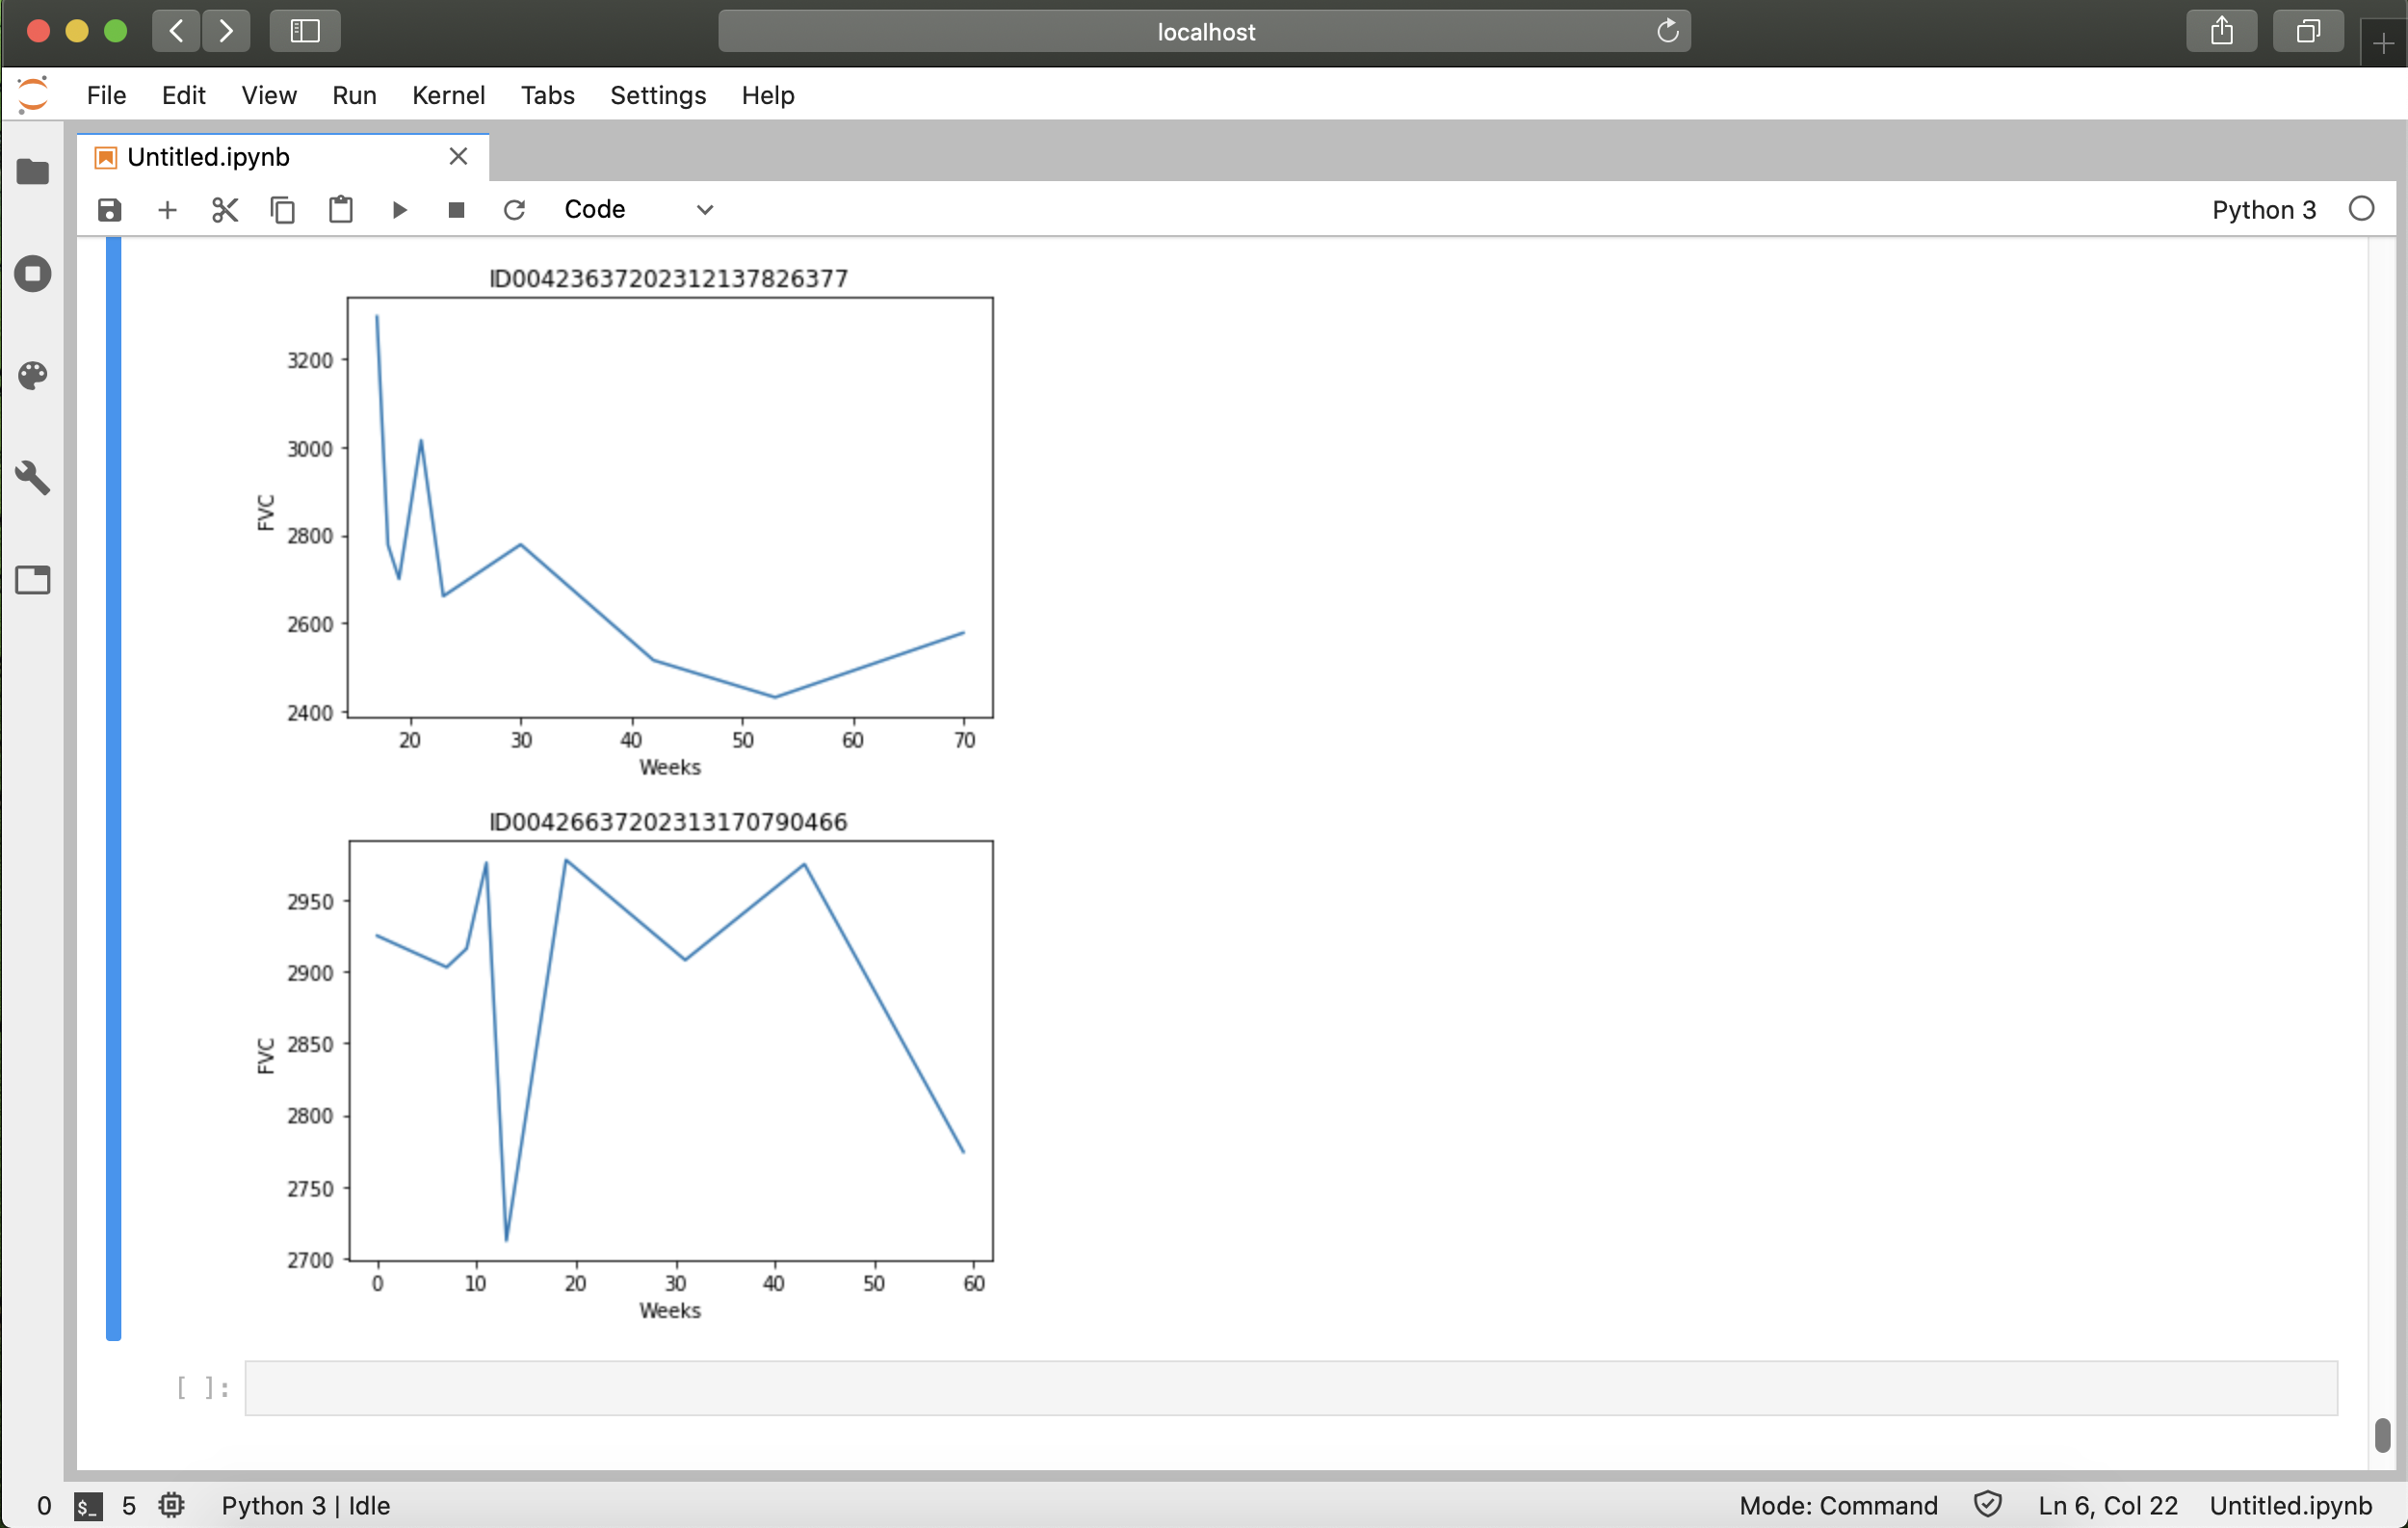
今回はkaggleのデータフレーム(OSIC Pulmonary Fibrosis Progression)を使用しました。ちなみに行と列の数は(1549,7)で重複をまとめると176行です。今回は176個分のグラフを一度に作成します。
① データフレームを読み込む
import pandas as pd
train_df = pd.read_csv("train.csv")
train_df
① ‘リストが重複している場合は新たなデータフレームとしてまとめておく(重複の削除)
new_df = train_df.groupby([train_df.Patient,train_df.Age,train_df.Sex, train_df.SmokingStatus])['Patient'].count() #重複のカウント
new_df.index = new_df.index.set_names(['id','Age','Sex','SmokingStatus'])
new_df = new_df.reset_index()
new_df.rename(columns = {'Patient': 'freq'},inplace = True)
new_df
② Forループを使って順番にグラフを作成していく
import matplotlib.pyplot as plt
for num in new_df['id']: #inで繰り返したい項目を選択(重複を省いたデータフレームを選択(new_df))
    train2 = train_df.loc[train_df.Patient == num] #取得したいカラムの選択
    graph = plt.plot(train2["Weeks"],train2["FVC"]) #グラフのX軸とY軸の値の取得
    plt.xlabel("Weeks") #X軸の名前
    plt.ylabel("FVC") #Y軸の名前
    plt.title("{}".format(num)) #タイトル
    plt.show()


