
今回は、気象庁ホームページから台風情報を取得し、地図形式で表示するページを作成していきます
台風予報について
気象庁では、台風や台風になる可能性のある熱帯低気圧の進路予報を6時間ごとに発表します。下のような台風経路図は、テレビやインターネットなどでご覧になったことのある方も多いと思います
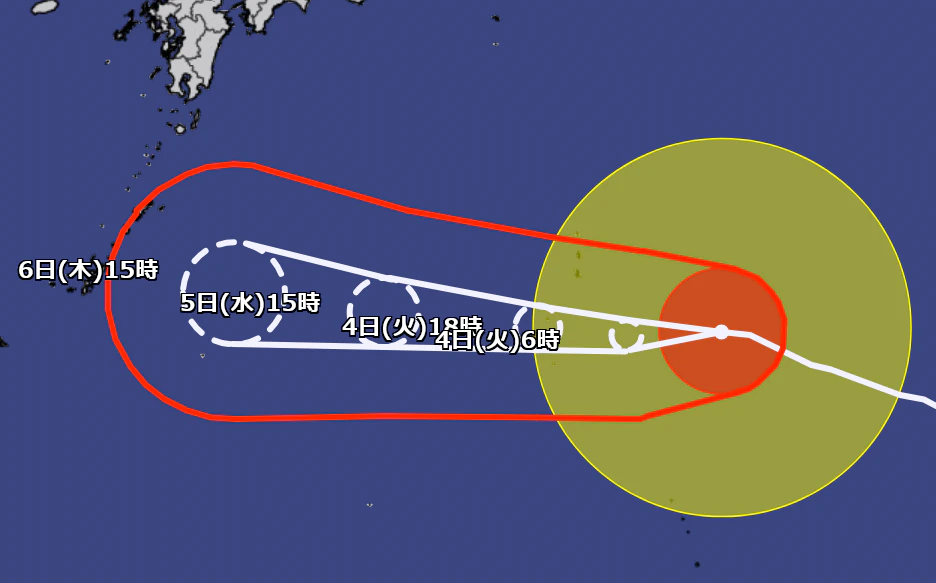
黄色い円と赤い円の中心にある白い点が、台風の中心位置です(×印で描かれている場合もあります)。発達した台風ではこの位置に台風の目があり、その周辺では最も強い風が吹いています
中心の周りの赤い円は暴風域と呼ばれ、風速25m/s以上の暴風の吹くおそれがある地域を、黄色い円は強風域と呼ばれ、風速15m/s以上の強い風の吹くおそれがある地域を表します。風速25m/sは何かにつかまっていないと立っていられないほどの風、風速15m/sは人が風に向かって歩けないほどの風です
暴風域の中での外出は非常に危険なため、大雨や高潮災害のおそれがある地域では暴風域に入る前に避難などを済ませる必要があります
中心位置から伸びる白い線に囲まれた円は予報円と言い、各時刻に中心が70%の確率で入る範囲を表します。予報時間が先になるほど、台風の進む速度や方向が絞り込めなくなっていくため、予報円は大きくなります。台風が大きくなることを表しているわけではないため注意が必要です
予報円の外側の赤い円は暴風警戒域と言い、風速25m/s以上の暴風の吹くおそれがある地域を表します
日本では台風予報は最長で5日先まで行われます。それ以上先の予報や、台風が低気圧(温帯低気圧)に変わった場合には予報はされませんが、台風の中には温帯低気圧に変わった後にふたたび発達して風が強まるものもあるため注意が必要です
予報円や暴風警戒域は各時刻の円を包絡する弧と接線で描かれることがあります。この接線の計算は非常に面倒で、配信資料に関する技術情報(気象編)第237号(気象庁)に計算方法が掲載されていますが、気象庁ホームページの内部ファイルには計算済みの弧と接線が格納されているため、これを利用して描画することができます
apiのURL
他の情報と同様、ブラウザの開発者ツールでネットワークタブを開いた状態で気象庁ホームページにアクセスし、Fetch/XHRでフィルタするとデータを格納したファイルが見つかります
- 現在情報を発表している台風の一覧は https://www.jma.go.jp/bosai/typhoon/data/targetTc.json
- それぞれの台風の実況・予報は
https://www.jma.go.jp/bosai/typhoon/data/{tcCode}/forecast.json
に格納されています。{tcCode}の部分は targetTc.json に格納されています。
また、今回の記事では描画を省略していますが、台風の中心位置の軌跡は
に格納されています
apiの構造
2026年台風13号の際のjsonファイルをダウンロードしたものを以下のページに転載しています
気象庁ホームページ jsonファイルのサンプル
現在情報を発表している台風の一覧(targetTc.json)
[
  {
    "tropicalCyclone": "TC2611", // TC番号(熱帯低気圧番号)
    "typhoonNumber": "2609", // 台風番号
    "category": "TY", // 台風の階級
    "issue": "2026-07-05T13:05:00+09:00" // 発表時刻
  },...
]
TC番号は、熱帯低気圧の発生順に振られる番号で、日本の気象庁(北西太平洋の台風の監視を担当)は「西暦の下2桁+台風の号数」という形で命名されます
台風番号は、熱帯低気圧が発達して台風となった場合に振られる番号で、毎年1号から順に振られます。熱帯低気圧の場合は「a」「b」等の番号が割り振られます。TC番号と台風番号は必ずしも一致しません
号数を選択するような場面では台風番号を使用しますが、台風経路の図示に使う forecast.json のURLや、 pastTracks.json 等のファイル内での台風の識別にはTC番号を用います。内部的な処理はTC番号を用いるのがよいでしょう
個別の台風の予想進路等(forecast.json)
[
  { // 共通部
    "part": "title",
    "issue": {
      "JST": "2026-08-03T15:45:00+09:00"
    }
  },
  { // 実況部
    "part": {
      "jp": "実況", "en": "Analysis"
    },
    "advancedHours": 0, // 予報時間(解析時刻から何時間後か)
    "validtime": {
      "JST": "2026-08-03T15:00:00+09:00" // 予報時間(日本時間)
    },
    "track": { // 過去経路
      "preTyphoon": [ // 熱帯低気圧だった期間
        [ 13.0, 179.6], [ 13.1, 178.9],......,[ 13.3, 176.9]
      ],
      "typhoon": [ // 台風だった期間
        [ 13.3, 176.9], [ 13.5, 176.1],......,[ 25.0, 147.2]
      ]
    },
    "center": [ 25.0, 147.2], // 中心位置
    "galeWarningArea": { // 強風域
      "center": [ 25.0, 147.2], // 中心
      "radius": 555600 // 半径
    },
    "stormWarningArea": { // 暴風域
      "arc": [
        [
          [ 25.0, 147.2], 185200, [ 0.0, 360.0] // 中心, 半径, 弧(何度から何度か)
        ]
      ]
    }
  },
  // (この間に1時間後の推定値(advancedHours=1)が入る場合がある)
  // (日本接近時には3時間ごとの予報が入る場合がある)
  { // 予報部(12時間後)
    "part": {
      "jp": "予報 12時間後"
    },
    "advancedHours": 12, // 予報時間(解析時刻から何時間後か)
    "validtime": {
      "JST": "2026-08-04T03:00:00+09:00" // 予報時間(日本時間)
    },
    "probabilityCircle": { // 予報円
      "radius": 46300, // 半径(m)
      "tangent": [ // 予報円の接線(1つ前(実況)とこの時刻の予報円に接する線)
        [
          [ 24.49, 144.29], [ 25.0, 147.2]
        ],
        [
          [ 25.0, 147.2], [ 25.31, 144.25]
        ]
      ]
    },
    "center": [ 24.9, 144.2], // 予報円の中心
    "stormWarningArea": { // 解析時刻からこの時間までの暴風警戒域
      "arc": [ // 弧の部分
        [
          [ 25.0, 147.2], 185200, [ 10.43, 165.74] // 中心, 半径(m), 弧(何度から何度か)
        ],
        [
          [ 24.9, 144.2], 250020, [ 0.0, 10.43]
        ],
        [
          [ 24.9, 144.2], 250020, [ 165.74, 360.0]
        ]
      ],
      "line": [ // 直線状の部分(接線)
        [
          [ 22.72, 144.81], [ 23.39, 147.65]
        ],
        [
          [ 26.64, 147.53], [ 27.11, 144.65]
        ]
      ]
    }
  },......
  {
    "part": {
      "jp": "予報 120時間後"
    },
    "advancedHours": 120,
    "validtime": {
      "JST": "2026-08-08T15:00:00+09:00"
    },
    "probabilityCircle": {
      "radius": 222240,
      "tangent": [
        [
          [ 25.76, 124.65], [ 24.99, 128.04]
        ],
        [
          [ 28.09, 129.35], [ 29.48, 126.23]
        ]
      ]
    },
    "center": [ 27.7, 125.2],
    "stormWarningArea": {
      "arc": [
        [
          [ 25.0, 147.2], 185200, [ 10.43, 165.74]
        ],
        [
          [ 24.9, 144.2], 250020, [ 165.74, 183.3]
        ],......
        [
          [ 27.7, 125.2], 444480, [ 193.99, 360.0]
        ]
      ],
      "line": [
        [
          [ 22.72, 144.81], [ 23.39, 147.65]
        ],
        [
          [ 26.64, 147.53], [ 27.11, 144.68]
        ],......
        [
          [ 30.04, 130.0], [ 31.26, 127.29]
        ]
      ]
    }
  }
]
過去の経路(track)には、直近の経路のみが格納されています。(熱帯低気圧→台風→)熱帯低気圧→台風というような経過をたどった場合には、かっこで囲んだ部分の経路は格納されないため、描画する際は pastTracks.json からデータを取得して描画する必要があります。また、経路は連続しない場合があるため、ひとつながりにしたい場合には間を点線でつなぐなどの処理が必要です
stormWarningArea は実況・1時間後の推定では暴風域を、予報では暴風警戒域を表します。実況は塗りつぶしで、予報は線のみで描きたいなど描き分けたい場合には advancedHours による条件分岐を行う必要があります
予報円(probabilityCircle)と暴風警戒域(stormWarningArea)は円(弧)と接線で構成されています。予報円は直前の時刻の予報円との間の接線が、暴風警戒域は解析時刻から予報時刻までの全ての円(弧)と接線が格納されています。描画する際には
- 描きたい時刻までの全てのprobabilityCircle と
- 描きたい時刻のみのstormWarningArea
を描画することになります
日本接近時には、3時間ごとの予報が格納される場合があります。このデータには、3時間ごとの予報円を描画する場合の接線(probabilityCircle.tangent_3h)が格納されています。通常の12時間ごとの予報と異なり、probabilityCircle.tangentが格納されていないことで区別できます
表示用のコード
ここまでの内容を使って、表示用のコードを書いていきます
アメダスのデータを地図表示した記事の時などと同様に、Leaflet.jsを用いて地図表示していきます
headタグ内でLeafletのスタイルシートとスクリプトを読み込みます(Leafletのチュートリアルからそのまま拝借)
<link rel="stylesheet" href="https://unpkg.com/leaflet@1.9.4/dist/leaflet.css"
   integrity="sha256-p4NxAoJBhIIN+hmNHrzRCf9tD/miZyoHS5obTRR9BMY="
   crossorigin=""/>
<script src="https://unpkg.com/leaflet@1.9.4/dist/leaflet.js"
   integrity="sha256-20nQCchB9co0qIjJZRGuk2/Z9VM+kNiyxNV1lvTlZBo="
   crossorigin=""></script>
地図を定義し、台風進路の格納用のレイヤーを定義します
let layers = {'fcst':L.layerGroup()};
let map = L.map('map').setView([35, 135], 5);
台風番号のリストを取得し、台風番号の選択欄を作成します
function getTargetTcs(){
  fetch("https://www.jma.go.jp/bosai/typhoon/data/targetTc.json")
  .then((response) => response.json())
  .then((targetTcs) => {
    makeTargetTcSelect( targetTcs);
  });
}

function makeTargetTcSelect(targetTcs){
  let targetTcSelect = "";
  for( let targetTc of targetTcs){
    targetTcSelect += "<option value='" + targetTc['tropicalCyclone'] + "'>"
    if( targetTc['typhoonNumber'].length>2){
      targetTcSelect += "台風" + targetTc['typhoonNumber'].slice(-2)*1 + "号";
    }else{
      targetTcSelect += "熱帯低気圧" + targetTc['typhoonNumber'];
    }
    targetTcSelect += "</option>";
  }
  document.getElementById("targetTc").innerHTML = targetTcSelect;
  getFcst();
}
選択された台風の予想進路を取得します
function getFcst(){
  let tcNumber = document.getElementById("targetTc").value;
  if( tcNumber!=""){
    fetch("https://www.jma.go.jp/bosai/typhoon/data/" + tcNumber + "/forecast.json")
    .then((response) =>  response.json())
    .then((forecast) => {
      display( forecast);
    });
  }
}
既存のレイヤーがあれば削除し、レイヤーを初期化します
if( map.hasLayer(layers['fcst'])){
  map.removeLayer(layers['fcst']);
}
layers['fcst'] = L.layerGroup();
電文を順番に解析し、強風域、暴風域、中心を描画します(暴風域・中心は予報時間(advancedHours)が0(実況)の時のみ描画します)
let advancedHours = forecast[i]['advancedHours']; // 予報時間(初期時刻から何時間後の予想か)
if( forecast[i]['galeWarningArea']!=undefined && advancedHours==0){ // 強風域。予報時間0(実況)の場合のみ描画
  let galeWarningCenter = forecast[i]['galeWarningArea']['center'];
  let galeWarningRadius = forecast[i]['galeWarningArea']['radius'];
  let galeWarning = L.circle(galeWarningCenter, {radius:galeWarningRadius, opacity:1, color:"#faf500", weight:2, fillColor:"#faf500", fillOpacity:0.5});
  layers['fcst'].addLayer( galeWarning);
}
if( forecast[i]['stormWarningArea']!=undefined && advancedHours==0){ // 暴風域。予報時間0(実況)の場合のみ描画
  for( let j in forecast[i]['stormWarningArea']['arc']){
    let stormWarning = L.circle(forecast[i]['stormWarningArea']['arc'][j][0], forecast[i]['stormWarningArea']['arc'][j][1], {opacity:1, color:"#ff2800", weight:2, fillColor:"#ff0000", fillOpacity:0.5});
    layers['fcst'].addLayer( stormWarning);
  }
}
if( forecast[i]['center']!=undefined && advancedHours==0){ // 中心。予報時間0(実況)の場合のみ描画
  let centerCoordinates = [];
  centerCoordinates.push( forecast[i]['center']); // 中心の点を、中心の座標×2を結ぶ線として描画
  centerCoordinates.push( forecast[i]['center']);
  let center = L.polyline(centerCoordinates,{ "color":"#f2f2ff", "weight":10, "opacity":1});
  layers['fcst'].addLayer( center);
}
予報円と暴風警戒域を描画します。前述の通り、予報円はその時刻のもののみが格納されているため全ての時刻で、暴風警戒域はその時刻までのすべてのものが格納されているため最後の時刻のみで描画します。(今回は3時間ごとの予報(probabilityCircle.tangent が格納されない)の予報円は描画を省いています。)暴風警戒域の描画では、後述する弧(部分円)を描く関数 arc() を呼び出しています
if( forecast[i]['probabilityCircle']!=undefined && forecast[i]['probabilityCircle']['tangent']!=undefined){ // 予報円
  let probabilityCircle = L.circle(forecast[i]['center'], {radius:forecast[i]['probabilityCircle']['radius'], weight:2, opacity:1, color:"#f2f2ff", dashArray:"2 8", fillOpacity:0});
  layers['fcst'].addLayer( probabilityCircle);
  for( let j in forecast[i]['probabilityCircle']['tangent']){
    let tangent = L.polyline(forecast[i]['probabilityCircle']['tangent'][j],{ color:"#f2f2ff", weight:2, opacity:1});
    layers['fcst'].addLayer( tangent);
  }
  let validTime = new Date( forecast[i]['validtime']['JST']);
  let fcstTime = L.divIcon({ html:"<span style='text-decoration:none; color:white'>" + dateFormat(validTime,'D日(w)H時') + "</span>", iconSize:[120,30], iconAnchor:[60,15], className:"plain center"});
  let fcstTimeMarker = L.marker([forecast[i]['center'][0] - forecast[i]['probabilityCircle']['radius']/80000, forecast[i]['center'][1]], {icon: fcstTime});
  layers['fcst'].addLayer( fcstTimeMarker);
}
if( forecast[i]['stormWarningArea']!=undefined && i==forecast.length-1){ // 暴風警戒域(最後の時刻のみ描画)
  for( let j in forecast[i]['stormWarningArea']['arc']){
    let stormWarning = arc(forecast[i]['stormWarningArea']['arc'][j], 'arc', {opacity:0, color:"#ff2800", weight:2, opacity:1, fillOpacity:0});
    layers['fcst'].addLayer( stormWarning);
  }
  for( let j in forecast[i]['stormWarningArea']['line']){
    let stormWarning = L.polyline(forecast[i]['stormWarningArea']['line'][j],{ color:"#ff2800", weight:2, opacity:1});
    layers['fcst'].addLayer( stormWarning);
  }
}
地図にこれまで描いてきたものを追加します
map.addLayer( layers['fcst']);
弧を描く関数は以下の通り。https://www.nanchatte.com/l/circle.html を参考に作成しました。第1引数は[中心座標, 半径, 弧の何度から何度の部分を描くか]の配列をとります
function arc( coordinates, mode="arc", options){
  let pos = coordinates[0], radius = coordinates[1], arc = [0,360];
  if( coordinates[2] != undefined){
    arc = [-1 * coordinates[2][1] + 90, -1 * coordinates[2][0] + 90];
  }

  // 赤道半径(m) (WGS-84)
  var EquatorialRadius = 6378137;
  // 扁平率の逆数 : 1/f (WGS-84)
  var F = 298.257223563;
  // 離心率の2乗
  var E = ((2 * F) -1) / Math.pow(F, 2);
  // 赤道半径 × π
  var PI_ER = Math.PI * EquatorialRadius;
  // 1 - e^2 sin^2 (θ)
  var TMP = 1 - E * Math.pow(pos[0] * Math.PI / 180, 2);
  // 経度1度あたりの長さ(m)
  var arc_lat = (PI_ER * (1 - E)) / (180 * Math.pow(TMP, 3/2));
  // 緯度1度あたりの長さ(m)
  var arc_lng = (PI_ER * Math.cos(pos[0] * Math.PI / 180)) / (180 * Math.pow(TMP, 1/2));

  var points = new Array();
  if( mode=='sector' && (arc[0]%360+360)%360!=(arc[1]%360+360)%360){
    points.push(pos);
  }
  for (let i=arc[0]; i<=arc[1]; i++) {
    var rad = (i / (360 / 2)) * Math.PI;
    var lat = (radius / arc_lat) * Math.sin(rad) + pos[0];
    var lng = (radius / arc_lng) * Math.cos(rad) + pos[1];
    points.push([lat, lng]);
  }
  if( mode=='sector' && (arc[0]%360+360)%360!=(arc[1]%360+360)%360){
    points.push(pos);
  }
  if( mode=='arc'){
    return L.polyline(points, options);
  }else{
    return L.polygon(points, options);
  }
}
表示ページ全体のソースコード
<!DOCTYPE html>
<html lang="ja">
<head>
  <meta charset="utf-8">
  <meta name="viewport" content="width=device-width">
  <title>台風(地図)</title>
  <!-- https://leafletjs.com/ -->
  <link rel="stylesheet" href="https://unpkg.com/leaflet@1.9.4/dist/leaflet.css"
     integrity="sha256-p4NxAoJBhIIN+hmNHrzRCf9tD/miZyoHS5obTRR9BMY="
     crossorigin=""/>
  <script src="https://unpkg.com/leaflet@1.9.4/dist/leaflet.js"
     integrity="sha256-20nQCchB9co0qIjJZRGuk2/Z9VM+kNiyxNV1lvTlZBo="
     crossorigin=""></script>
  <style>
    *{ font-family:sans-serif;}
    html, body{ width:100%; height:100%; margin:0; overflow:hidden;}
    body{ display:flex; flex-direction:column;}
    div#menu{ flex:0.01;}
    div#map{ flex:0.99; background:#3b4580;}
    .center{ text-align:center;}
    .icon{ background:#0000;}
    .plain{ font-weight:bold; font-size:14px; -webkit-text-stroke:2px black; paint-order: stroke fill;}
  </style>
</head>
<body>
  <div id="menu">
    <select id="targetTc"></select>
  </div>
  <div id="map"></div>
  <script>
    "use strict";
    let layers = {'fcst':L.layerGroup()};
    let map = L.map('map').setView([35, 135], 5);

    initialize();

    function initialize(){
      L.control.layers({
        "気象庁地図":L.tileLayer('https://www.jma.go.jp/tile/jma/gray-cities/{z}/{x}/{y}.png', { minZoom:4, maxZoom:12, maxNativeZoom:10, attribution: '<a href="https://www.jma.go.jp/jma/kishou/info/coment.html">気象庁</a>'}).addTo(map),
        "地理院地図":L.tileLayer('https://maps.gsi.go.jp/xyz/pale/{z}/{x}/{y}.png', { minZoom:2, maxZoom:18, attribution: '<a href="https://maps.gsi.go.jp/development/ichiran.html">国土地理院</a>'})
      }).addTo(map);
      getTargetTcs();
    }

    function getTargetTcs(){
      fetch("https://www.jma.go.jp/bosai/typhoon/data/targetTc.json")
      .then((response) => response.json())
      .then((targetTcs) => {
        makeTargetTcSelect( targetTcs);
      });
    }

    function makeTargetTcSelect(targetTcs){
      let targetTcSelect = "";
      for( let targetTc of targetTcs){
        targetTcSelect += "<option value='" + targetTc['tropicalCyclone'] + "'>"
        if( targetTc['typhoonNumber'].length>2){
          targetTcSelect += "台風" + targetTc['typhoonNumber'].slice(-2)*1 + "号";
        }else{
          targetTcSelect += "熱帯低気圧" + targetTc['typhoonNumber'];
        }
        targetTcSelect += "</option>";
      }
      document.getElementById("targetTc").innerHTML = targetTcSelect;
      getFcst();
    }

    document.getElementById("targetTc").addEventListener("change", function(e){
      getFcst();
    });

    function getFcst(){
      let tcNumber = document.getElementById("targetTc").value;
      if( tcNumber!=""){
        fetch("https://www.jma.go.jp/bosai/typhoon/data/" + tcNumber + "/forecast.json")
        .then((response) =>  response.json())
        .then((forecast) => {
          display( forecast);
        });
      }
    }

    function display( forecast){
      if( map.hasLayer(layers['fcst'])){
        map.removeLayer(layers['fcst']);
      }
      layers['fcst'] = L.layerGroup();
      for( let i in forecast){
        let advancedHours = forecast[i]['advancedHours'];
        if( forecast[i]['galeWarningArea']!=undefined && advancedHours==0){
          let galeWarningCenter = forecast[i]['galeWarningArea']['center'];
          let galeWarningRadius = forecast[i]['galeWarningArea']['radius'];
          let galeWarning = L.circle(galeWarningCenter, {radius:galeWarningRadius, opacity:1, color:"#faf500", weight:2, fillColor:"#faf500", fillOpacity:0.5});
          layers['fcst'].addLayer( galeWarning);
        }
        if( forecast[i]['stormWarningArea']!=undefined && advancedHours==0){
          for( let j in forecast[i]['stormWarningArea']['arc']){
            let stormWarning = L.circle(forecast[i]['stormWarningArea']['arc'][j][0], forecast[i]['stormWarningArea']['arc'][j][1], {opacity:1, color:"#ff2800", weight:2, fillColor:"#ff0000", fillOpacity:0.5});
            layers['fcst'].addLayer( stormWarning);
          }
        }
        if( forecast[i]['center']!=undefined && advancedHours==0){
          let centerCoordinates = [];
          centerCoordinates.push( forecast[i]['center']);
          centerCoordinates.push( forecast[i]['center']);
          let center = L.polyline(centerCoordinates,{ "color":"#f2f2ff", "weight":10, "opacity":1});
          layers['fcst'].addLayer( center);
        }
        if( forecast[i]['probabilityCircle']!=undefined && forecast[i]['probabilityCircle']['tangent']!=undefined){
          let probabilityCircle = L.circle(forecast[i]['center'], {radius:forecast[i]['probabilityCircle']['radius'], weight:2, opacity:1, color:"#f2f2ff", dashArray:"2 8", fillOpacity:0});
          layers['fcst'].addLayer( probabilityCircle);
          for( let j in forecast[i]['probabilityCircle']['tangent']){
            let tangent = L.polyline(forecast[i]['probabilityCircle']['tangent'][j],{ color:"#f2f2ff", weight:2, opacity:1});
            layers['fcst'].addLayer( tangent);
          }
          let validTime = new Date( forecast[i]['validtime']['JST']);
          let fcstTime = L.divIcon({ html:"<span style='text-decoration:none; color:white'>" + dateFormat(validTime,'D日(w)H時') + "</span>", iconSize:[120,30], iconAnchor:[60,15], className:"plain center"});
          let fcstTimeMarker = L.marker([forecast[i]['center'][0] - forecast[i]['probabilityCircle']['radius']/80000, forecast[i]['center'][1]], {icon: fcstTime});
          layers['fcst'].addLayer( fcstTimeMarker);
        }
        if( forecast[i]['stormWarningArea']!=undefined && i==forecast.length-1){
          for( let j in forecast[i]['stormWarningArea']['arc']){
            let stormWarning = arc(forecast[i]['stormWarningArea']['arc'][j], 'arc', {opacity:0, color:"#ff2800", weight:2, opacity:1, fillOpacity:0});
            layers['fcst'].addLayer( stormWarning);
          }
          for( let j in forecast[i]['stormWarningArea']['line']){
            let stormWarning = L.polyline(forecast[i]['stormWarningArea']['line'][j],{ color:"#ff2800", weight:2, opacity:1});
            layers['fcst'].addLayer( stormWarning);
          }
        }

      }
      map.addLayer( layers['fcst']);
    }

    // https://www.nanchatte.com/l/circle.html を参考に作成
    function arc( coordinates, mode="arc", options){
      let pos = coordinates[0], radius = coordinates[1], arc = [0,360];
      if( coordinates[2] != undefined){
        arc = [-1 * coordinates[2][1] + 90, -1 * coordinates[2][0] + 90];
      }

      // 赤道半径(m) (WGS-84)
      var EquatorialRadius = 6378137;
      // 扁平率の逆数 : 1/f (WGS-84)
      var F = 298.257223563;
      // 離心率の2乗
      var E = ((2 * F) -1) / Math.pow(F, 2);
      // 赤道半径 × π
      var PI_ER = Math.PI * EquatorialRadius;
      // 1 - e^2 sin^2 (θ)
      var TMP = 1 - E * Math.pow(pos[0] * Math.PI / 180, 2);
      // 経度1度あたりの長さ(m)
      var arc_lat = (PI_ER * (1 - E)) / (180 * Math.pow(TMP, 3/2));
      // 緯度1度あたりの長さ(m)
      var arc_lng = (PI_ER * Math.cos(pos[0] * Math.PI / 180)) / (180 * Math.pow(TMP, 1/2));

      var points = new Array();
      if( mode=='sector' && (arc[0]%360+360)%360!=(arc[1]%360+360)%360){
        points.push(pos);
      }
      for (let i=arc[0]; i<=arc[1]; i++) {
        var rad = (i / (360 / 2)) * Math.PI;
        var lat = (radius / arc_lat) * Math.sin(rad) + pos[0];
        var lng = (radius / arc_lng) * Math.cos(rad) + pos[1];
        points.push([lat, lng]);
      }
      if( mode=='sector' && (arc[0]%360+360)%360!=(arc[1]%360+360)%360){
        points.push(pos);
      }
      if( mode=='arc'){
        return L.polyline(points, options);
      }else{
        return L.polygon(points, options);
      }
    }

    function dateFormat( d, f='y-m-dTh:n:s'){
      const j=["日","月","火","水","木","金","土"];const e=["Sun","Mon","Tue","Wed","Thu","Fri","Sat"];
      f=f.replace(/y/g,("000"+d.getFullYear()).slice(-4)).replace(/Y/g,d.getFullYear()).replace(/m/g,("0"+(d.getMonth()+1)).slice(-2)).replace(/M/g,d.getMonth()+1).replace(/d/g,("0"+d.getDate()).slice(-2)).replace(/D/g,d.getDate());
      f=f.replace(/w/g,j[d.getDay()]).replace(/W/g,e[d.getDay()]);
      f=f.replace(/h/g,("0"+d.getHours()).slice(-2)).replace(/H/g,d.getHours()).replace(/n/g,("0"+d.getMinutes()).slice(-2)).replace(/N/g,d.getMinutes()).replace(/s/g,("0"+d.getSeconds()).slice(-2)).replace(/S/g,d.getSeconds());
      return f;
    }
  </script>
</body>
</html>