この前運動しなきゃなぁとか思って流行に乗ってリングフィット買ったんですよ。
2か月ほどたった今、ほとんどやってない気がする(前まで毎日してたのに今じゃ週一くらいか…)
これじゃいかん!モチベ維持しないと!と思って、運動量と運動時間を視覚化したいなと思ったわけです。
なにをするん?
で、やりたいこととしてはリングフィットの運動データの取得とグラフ化です。リングフィットのAPIあるんかなと思ったけどどうやらなさそう。
なのでtwitterに画像上げて、そっからデータを取得したいと思います。
- twitterからリングフィットのツイート取得
- ツイートから画像DL
- 取得画像からデータ抜きだし(OCR)
- 抜き出したデータからグラフ作成
こんな流れでやろうかと思います。
環境
実行環境です。
| 環境 | ver |
|---|---|
| OS | windows10 |
| python | 3.7 |
twitterからデータ持ってくる
ではまずtwitterからデータを持ってきたいです。
たぶんスクレイピングするかAPIたたくかの2つの手段があると思います。今回はAPIでやっていきます。
なので、twitterAPIの申請をします。→こちら
twitterアカウントで電話番号の登録しないといけないので、事前に登録しておきましょう(ここで詰まってた)
英語で申請内容書き込む必要があるんですが、google先生に翻訳してもらってコピペしたらいけました。さすが先生です。
では画像の取得をやっていきましょう。swichから画像を送ると、ハッシュタグに撮ったゲーム名がついてきます。
なので、「アカウント」「#リングフィットアドベンチャー」でフィルターをかけて「今日からX日前まで」のデータを取得しようと思います。
- アカウント、ハッシュタグでフィルター
- 今日からX日前までのデータ取得
- 画像をDL
まずtwitterAPIを利用するにあたりtweepyを使いました。
pip install tweepy
tweepyの初期化をする
tweepyの初期化を行います。私は必用データをjsonにまとめてそこから初期化する関数を作りました。べた書きでも問題はないと思います。引数にconfig.jsonのpathを入れて使う感じにしました。
{
    "CONSUMER_KEY": "your key",
    "CONSUMER_SECRET": "your secret key",
    "ACCESS_TOKEN": "your token",
    "ACCESS_TOKEN_SECRET": "your secret token"
}
# tweepyの初期化
def init_twitter_api(config: dict) -> object:
    auth = tweepy.OAuthHandler(config['CONSUMER_KEY'], config['CONSUMER_SECRET'])
    auth.set_access_token(config['ACCESS_TOKEN'], config['ACCESS_TOKEN_SECRET'])
    return tweepy.API(auth)
続いてtwitterからデータを取得しましょう。
TLから特定のデータを取得する
データ取得は一つの関数でまとめて書いちゃいました。
ユーザー名と検索文字列を渡して、何ヵ月前かを入れるとデータを持ってきてくれる関数です。
最初の引数は初期化したAPIのオブジェクトです。
やってる内容としては
- ユーザーのTLデータを取得
- いつまでのデータを取得するか計算(lastmonth)
- 特定の日付になるまで4を繰り返す
- 特定の文字列を含むツイートだった場合、日付と画像のURLをlistに追加
です。
フィルターだったり日付のデータ取得だったりの順番がめちゃくちゃなんですが、sinceとかのキーワード使ったものだとなぜか画像がうまくDLできなかったためこの手法にしました。
# twitterから、end_dateヵ月前までのデータ取得
def get_img_data_from_TL(api: object, user_id: str, serch_text: str, end_date: int) -> object:
    image_url_list = []
    print(f"get {user_id}'s TL now...")
    search_results = tweepy.Cursor(api.user_timeline, screen_name=user_id).items()
    today = datetime.today()
    lastmonth = today - relativedelta(months=end_date)
    print(f"get [{serch_text}] until {lastmonth}")
    for i, result in enumerate(search_results):
        try:
            if i%50 == 0:
                print('.')
            if result.created_at < lastmonth:
                break
            if serch_text in result.text:
                image_url_list.append(
                    {
                        "created_at": result.created_at,
                        "img_url": result.extended_entities["media"][0]["media_url"]
                    }
                )
        except Exception as e:
            print(e)
    return image_url_list
最後にURLから画像を保存します。
画像のダウンロード
作成した関数は、URLとダウンロード先のpath(ファイル名込み)を指定してあげるとそこに画像をDLするものになります。
- URLを開く
- 画像を保存する
単純ですね。
# 画像のDL
def download_file(url: str, dst_path: str) -> None:
   try:
       with urllib.request.urlopen(url) as web_file:
           data = web_file.read()
           with open(dst_path, mode="wb") as local_file:
               local_file.write(data)
   except urllib.error.URLError as e:
       print(e)
では実際に動かしてみたいと思います。
実行してみる
左を見てみると画像が生成されているのがわかると思います。
if __name__ == "__main__":
    user_id = "tumugi3205"
    serch_text = "リングフィットアドベンチャー"
    end_date = 3
    with open("config/config.json") as f:
        conf = json.load(f)
    api = init_twitter_api(conf)
    image_url_list = get_img_data_from_TL(api, user_id, serch_text, end_date)
    for data in image_url_list:
        dst_path = f"get_data/{data['created_at'].strftime('%Y-%m-%d')}.png"
        download_file(data['img_url'],dst_path)
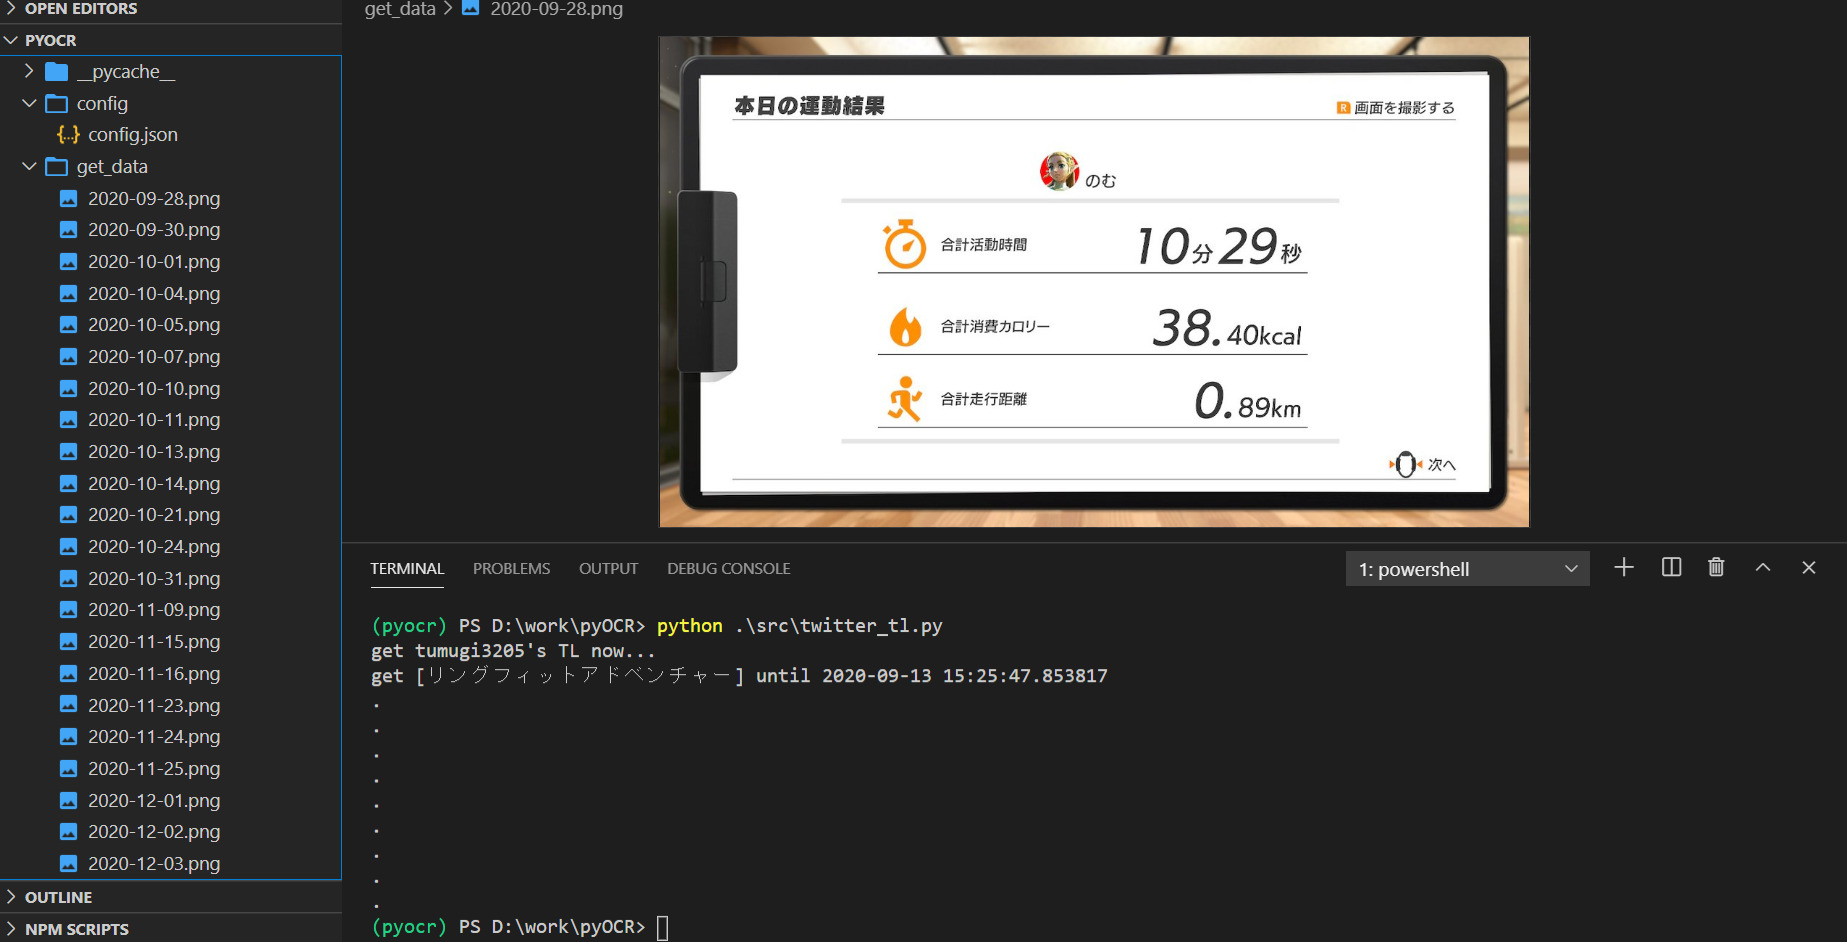
これでtwitterから画像を取得することができました!
画像からデータ取得
続いて画像からテキストデータを抜き出してみたいと思います。
pythonではTesseractを使って簡単にOCRすることができます。
こちらの記事を参考に導入しました。→PythonでOCRを実行する方法
pythonでTesseractを使うためにpyocrを使います。
pip install pyocr
ではこれで画像からデータを取得してみましょう!
OCRしてみる
とりあえずそのままOCRやってみました。
# pyocrの初期化
def startup_ocr() -> Any:
    tools = pyocr.get_available_tools()
    if len(tools) == 0:
        print("No OCR tool found")
        sys.exit(1)
    return tools[0]

if __name__ == "__main__":
    img = cv2.imread("get_data/2020-09-28.png")
    tool = startup_ocr()
    lang = "jpn"
    print(tool.image_to_string(Image.open("get_data/2020-09-28.png"), lang=lang))
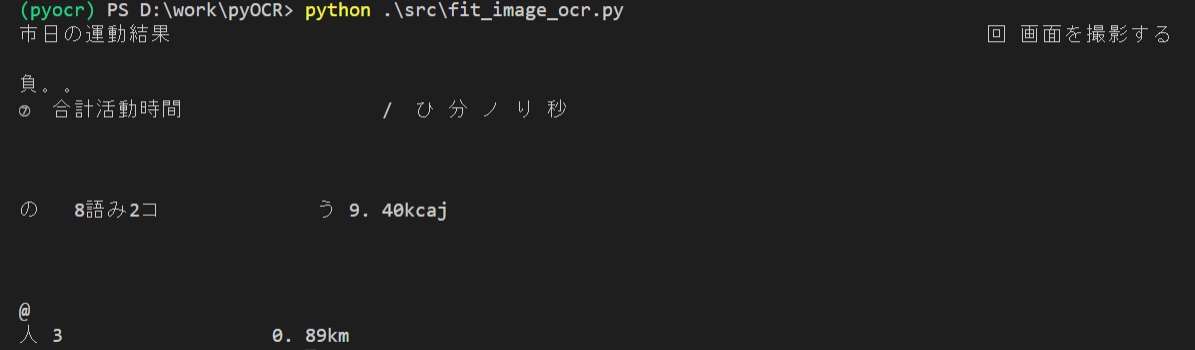
ん~これじゃさすがにデータにはできませんね…
最初に前処理する必要がありそうです。
画像の前処理
この画像には、運動時間,消費カロリー,移動距離の3つがあります。
場所は毎回固定なので、特定の位置だけ抜き出してしまいましょう。
また、どうやら日本語だと数値が上手に読み取れないようなので、時間データは分の部分を数値のみで取得したいと思います。
一桁時間が07のような表記ではなく単純な1文字表記なので、そのずれも考慮して範囲を区切ります。(試行錯誤でやりました。)
それが下の関数です。
- ファイルの取得
- 切り抜き範囲の指定
- 切り抜き画像の出力
- 出力ファイル情報を辞書として出力
# pathからファイル名のみ抜き出し
def get_file_name(file_path: str) -> str:
    return file_path.split("/")[-1].split(".")[0]

# 前処理
def overview_preprosess(file_path: str) -> dict:
    file_name = get_file_name(file_path)
    img = Image.open(file_path)
    width_section = img.width/4
    height_section = img.height/6
    create_path = {}

    rect_dic = {
        "time": (600, 250, 770, 320),
        "kcal": (width_section*2, height_section*3, width_section*3,height_section*4),
        "km": (width_section*2, height_section*4, width_section*3,height_section*5)
    }

    for name, rect in rect_dic.items():
        try:
            os.mkdir("prepro")
        except:
            pass
        output_path = f"prepro/{file_name}_{name}.jpg"
        prepro = img.crop(box=(rect))
        prepro.save(output_path, format="jpeg")
        create_path[name] = output_path

    return create_path
前処理できたのでOCRやってきましょう。
OCRする
やることは単純ですね。
- pyocrの初期化
- 先ほど出力したファイルpathからデータ取得
- OCRする
# OCRでデータ取得
def file_ocr(do_dir: list) -> list:
    ocr_list = []
    tool = startup_ocr()
    for filename in os.listdir(do_dir):
        ocr_text_dict = {}
        output_path = overview_preprosess(f"{do_dir}/{filename}")
        for name, path in output_path.items():
            img = cv2.imread(path)
            lang = "eng"
            ocr_text_dict[name] = tool.image_to_string(Image.open(path), lang=lang)
        ocr_text_dict["read_file_name"] = filename
簡単にOCRできますね。すごい簡単ですよ。では結果を見てみましょう。
[
  {
    "time": "10+",
    "kcal": "38. AOkcal",
    "km": "O. 89km",
    "read_file_name": "2020-09-28.png"
  },
  {
    "time": "16",
    "kcal": "42. 69kcal",
    "km": "O. 59km",
    "read_file_name": "2020-09-30.png"
  },
  {
    "time": "223",
    "kcal": "7 ] 2 O9kcal",
    "km": "1. 29km",
    "read_file_name": "2020-10-01.png"
  },
  {
    "time": "1445",
    "kcal": "Af Bike",
    "km": "1. 03km",
    "read_file_name": "2020-10-04.png"
  }
  ...
]
いやぁ...これでもだめみたいです。
というわけで、後処理もやっていきましょう。
データの後処理
間違った判定(1を]と判定、ありえない数値になってる)で原因がわかる範囲は置換、わからない場合はもうerrorとするようにします。
仕方ないね。
- わかる範囲で置換
- 文字列は削除
- 時間は頭二桁だけ取得する
- 距離は消費カロリーに少数点がない場合は後ろ2桁の前に小数点を打つ
- 作成したデータが200を超える場合
errorにする(そんなに運動しないので) - 作成したデータが数値に変換できない場合は
errorとする
# 後処理
def post_processing(ocr_text_dict: dict) -> dict:
    for name, text in ocr_text_dict.items():
        ocr_text_dict[name] = ocr_text_dict[name].replace("A", "4").replace(".", ".").replace("Zu", "2.").replace("o", "0").replace(" ", "").replace("]", "1")
        ocr_text_dict[name] = re.sub("[a-zA-Z]","", ocr_text_dict[name])

        if name == "time":
            if len(ocr_text_dict[name])>2:
                ocr_text_dict[name] = ocr_text_dict[name][:2]
        if  len(ocr_text_dict[name])>4 and "." not in ocr_text_dict[name]:
            ocr_text_dict[name] = f"{ocr_text_dict[name][:len(ocr_text_dict[name])-2]}.{ocr_text_dict[name][-2:]}"

        try:
            ocr_text_dict[name] = float(ocr_text_dict[name])
            if ocr_text_dict[name] > 200:
                raise Exception
        except:
            if name != "read_file_name":
                ocr_text_dict[name] = "error"
    return ocr_text_dict
これをさっきのOCRの後に実行させます。(read_file_nameは前処理いらないので最後に追加します。)
すると…
[
  {
    "time": 10.0,
    "kcal": 38.4,
    "km": 0.89,
    "read_file_name": "2020-09-28.png"
  },
  {
    "time": 16.0,
    "kcal": 42.69,
    "km": 0.59,
    "read_file_name": "2020-09-30.png"
  },
  {
    "time": 22.0,
    "kcal": "error",
    "km": 1.29,
    "read_file_name": "2020-10-01.png"
  },
  {
    "time": 14.0,
    "kcal": 4.0,
    "km": 1.03,
    "read_file_name": "2020-10-04.png"
  }
  ...
]
だいぶ良くなったみたいです!
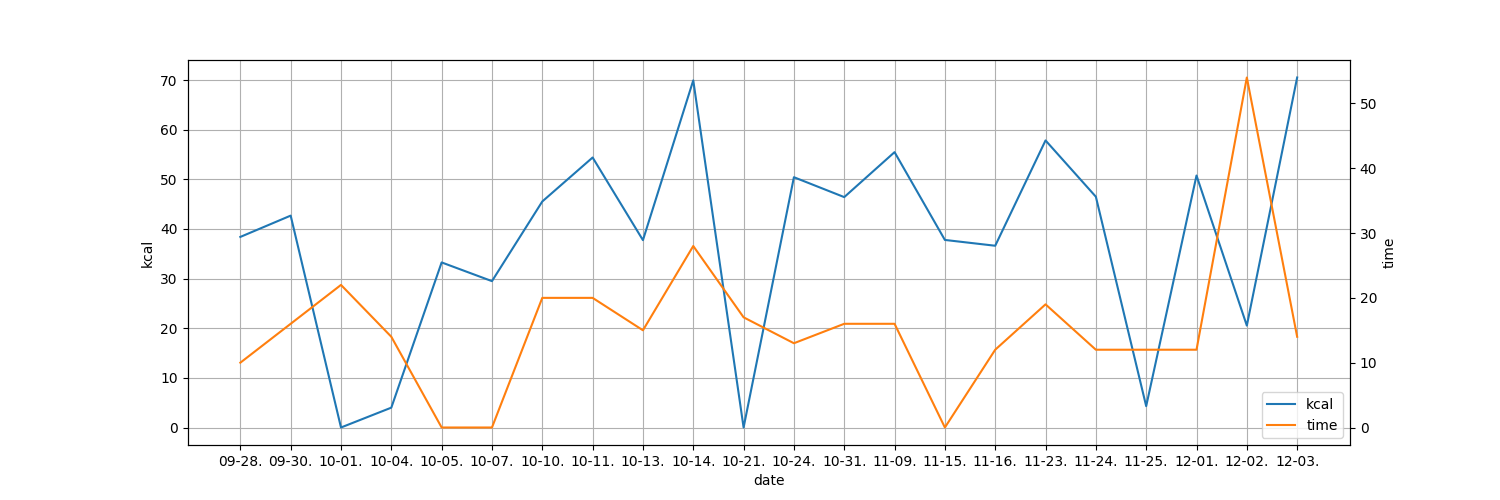
それではこの出力データからグラフを作ってみましょう。
グラフの作成
グラフはmatplotlibを使って簡単に作っちゃいましょう。
pip install matplotlib
今回は運動時間と消費カロリーの二つのグラフを表示したいと思います。
- データの読み込み
- グラフ用にデータを整形
-
errorの場合値を0にする - 消費カロリーのグラフ設定
- 運動時間のグラフ設定
- 出力
matplotlibではいろんなグラフが書けるようなのですが、今回は折れ線グラフをふたつ表示します。細かいことは省きますが、
- グラフの大きさ決める(フォントとか)
- 原点を決める(たぶん)
- データ追加
- headerとかgridとかつける
- 保存
って流れです。
import json

import matplotlib.pyplot as plt

def create_graph(input_path: str, output_path: str):
    with open(input_path) as f:
        data = json.load(f)

    date = []
    kcal = []
    time = []
    for val in data:
        date.append(val["read_file_name"].replace("2020-", "").replace(".png", ""))
        kcal.append(val["kcal"])
        time.append(val["time"])

    kcal = [float(str(k).replace("error", "0")) for k in kcal]
    time = [float(str(t).replace("error", "0")) for t in time]


    fig = plt.figure(figsize=(15, 5))
    ax1 = fig.add_subplot(111)
    ln1=ax1.plot(date, kcal,'C0',label=r'kcal')
    ax2 = ax1.twinx()
    ln2=ax2.plot(date, time,'C1',label=r'time')
    h1, l1 = ax1.get_legend_handles_labels()
    h2, l2 = ax2.get_legend_handles_labels()
    ax1.legend(h1+h2, l1+l2, loc='lower right')
    ax1.set_xlabel('date')
    ax1.set_ylabel(r'kcal')
    ax1.grid(True)
    ax2.set_ylabel(r'time')
    plt.savefig(output_path)
以上でtwitterからデータを取得し、OCRしてグラフの作成をすることができました。
使ってみる
では実際に実行してみましょう。
import json
import os

from src.twitter_tl import init_twitter_api, get_img_data_from_TL, download_file
from src.fit_image_ocr import file_ocr
from src.graph import create_graph

USER_ID = "tumugi3205"
SERCH_TEXT = "リングフィットアドベンチャー"
END_MONTH = 3

IMPORT_FILE_PATH = "output/ocr_result.json"
OUTPUT_FILE_PATH = "output/graph.png"

if __name__ == "__main__":
    with open("config/config.json") as f:
        CONFIG = json.load(f)

    # twitter APIの設定
    api = init_twitter_api(CONFIG)

    # 特定ユーザーのTLから特定文言の入ったツイートを取得、そこに入ってる画像の一枚目のURLを取得
    image_url_list = get_img_data_from_TL(api, USER_ID, SERCH_TEXT, END_MONTH)

    # 取得した画像URLからDL(ファイル名はツイート日時)
    for data in image_url_list:
        try:
            os.mkdir("get_data")
        except:
            pass
        dst_path = f"get_data/{data['created_at'].strftime('%Y-%m-%d')}.png"
        download_file(data['img_url'],dst_path)

    # DLした画像ファイルからデータ作成、出力
    ocr_data = file_ocr("./get_data")
    try:
        os.makedirs(IMPORT_FILE_PATH.replace(IMPORT_FILE_PATH.split("/")[-1], ""))
    except:
        pass
    with open(IMPORT_FILE_PATH, "w") as f:
        json.dump(ocr_data, f, indent=2)

    create_graph(IMPORT_FILE_PATH, OUTPUT_FILE_PATH)
できた!
まとめ
今回はtwitterからリングフィットの画像を取得し、OCRでデータ化してグラフを作成してみました。
Tesseractは無料で簡単ですが精度はあんま良くないみたいですね。前処理と後処理の大切さがよくわかります。
実は、抜き出す必要があるのは数値データだけなので、1~9の画像データを全部作って、画像処理すればちゃんとしたデータをとれるんじゃないかなと思っています。(画像処理苦手なのでたぶんやらないですけど。)
googleドキュメントでOCRしたところかなりの精度でできていたので、有料であればgoogleAPIでOCRすると良いのかもしれません。
AWSのAmazon Textractも使ってみたのですが、日本語対応してなかったのであきらめてしまいました。
前処理した後のデータであればかなりの精度で予測してくれたのですが、やはり有料なので少しハードル高いですね。
1実行当たり0.16円ほどなので、画像データを表みたいにまとめて一回でOCRしちゃえば安くいけそうですね。(Amazon Textractは表形式にも対応してるみたいです。)
これをサービスにする際にはAmazon Textractの導入を検討してみたいと思います。