はじめに
SBOMの活用の推進が進む昨今,まだSBOMをどのように管理したら良いのか,明確な答えがあるわけではありません.Jsonやスプレッドシートで流通することが多いとは思いますが,それらをそのまま管理したい人は少ないのではないでしょうか?
As the promotion of the use of SBOM continues, there is still no clear answer as to how to manage SBOM.I believe that they are often distributed in Json or spreadsheets, but not many people want to manage them as they are.
Eclipse SW360のようなウェブアプリケーションベースのソフトウェアカタログ管理ツールでSBOM管理する方法もありますが,全く新しいアプローチとして, GUAC(Graph for Understanding Artifact Composition )という,グラフでSBOMを管理することができるOSSツールがリリースされました。
There is a way to manage SBOM with a software web application catalog tool such as Eclipse SW360, but as a completely new approach, GUAC (Graph for Understanding Artifact Composition ), an OSS tool that can manage artifacts in graph form, has been released. GUAC (Graph for Understanding Artifact Composition ) is an OSS tool that allows you to manage artifacts by graphs.
GUAC : https://github.com/guacsec/guac
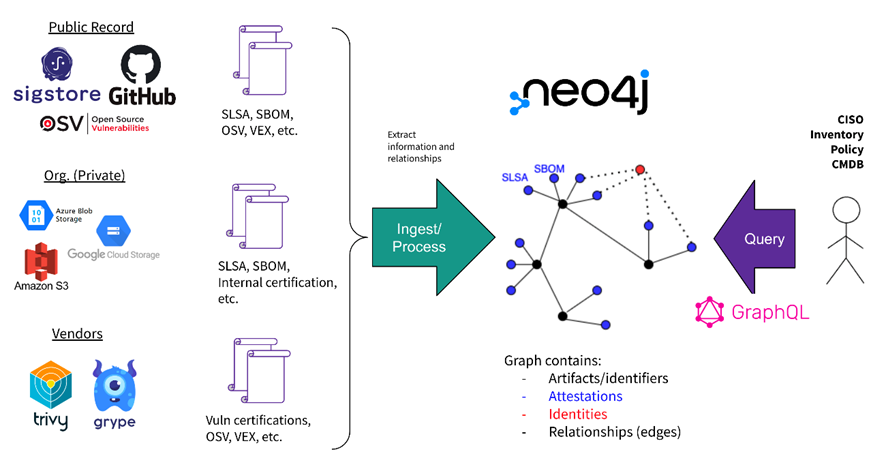
上記はGitHubにあるGUACの説明図です。GUACはSBOMなどのデータを取り込み、GraphQL言語でクエリを実行して操作を行います。この時、SBOMや脆弱性情報を一つの点とし、それらの関係性をグラフとして(Neo4j上で)管理します。これによりソフトウェアの間の複雑な依存関係や脆弱性情報関係を、厳密に、かつ、視覚的にわかりやすく行うことができそうです。
Above is an illustration of GUAC on GitHub, which takes data such as SBOM and performs operations by executing queries in the GraphQL language. At this time, SBOM and vulnerability information is considered as a single point, and their relationships are managed as a graph (on Neo4j). This is likely to make complex dependency and vulnerability information relationships between software strictly and visually understandable.
本記事では簡単にインストール方法と簡単な利用方法を紹介したいと思います.なお "GUAC is under active development(GUACは現在活発に開発中です)" とのことですので,改善点を思いついた人はコントリビューションに挑戦してみるのも良いかもしれません.
In this article, I would like to briefly introduce how to install and use GUAC. GUAC is under active development, so those who have ideas for improvements may want to try contributing to the project.
ここからは日本語のみです。
This blog is only displayed in Japanese from here.
GUACの構成
GUACはでグラフで情報を管理するためNeo4jというグラフデータベースを利用しています。基本的な操作も、このNeo4jのGUIから行うことになります。
また本記事では動作検証のため、既にあるサンプルデータセットを利用します。
このデータを入れる作業についても次の章のインストール方法部分に含みます。
これらのデータの中にはsyft (https://github.com/anchore/syft )というツールで作成されたSPDX形式のSBOMなどが含まれています。
GUAC のインストール方法
GUACのGitHubを参考に作業を進めます。なお、日々開発が進んでおり、今後この方法や結果が変わることも考えられるので、今回検証したCommit IDを記載しておきます。
guac-data
commit id : 0b58cd38a0ca6ecec5f71f8e13f39ddea57343b3
guac
commit id : af22f872b62468a2ea493cf0765aa95695f5ab84
なお,環境構築に以下が必要です
- make
- npm (some makefile tasks use npx)
- docker
- golang 1.18+
必要なものを揃えたら,適当なフォルダを作成し,そこに以下をクローンしてみましょう
   $  export GUACSEC_HOME="$(go env GOPATH)/src/github.com/guacsec"
   $  mkdir -p ${GUACSEC_HOME}
   $  git clone https://github.com/guacsec/guac-data.git
   $  git clone https://github.com/guacsec/guac.git
次に データベースとしてつかうNeo4jを以下で設定し,そこにデータを挿入します
#なお以下の操作にはProxy設定が必要な場合があります.
   $  docker run --rm \
  -p7474:7474 \
  -p7687:7687 \
  -e NEO4J_AUTH=neo4j/s3cr3t \
  -e NEO4J_apoc_export_file_enabled=true \
  -e NEO4J_apoc_import_file_enabled=true \
  -e NEO4J_apoc_import_file_use__neo4j__config=true \
  -e NEO4JLABS_PLUGINS=\[\"apoc\"\] \
  neo4j:4.4.9-community
   $  cd guac
   $  make build
   $  bin/guacone files --gdbuser neo4j --gdbpass s3cr3t ${GUACSEC_HOME}/guac-data/docs
GUAC の利用方法
ここまで作業が完了すれば、ブラウザから http://localhost:7474
を開くことで以下の画面にたどりつくことができます.
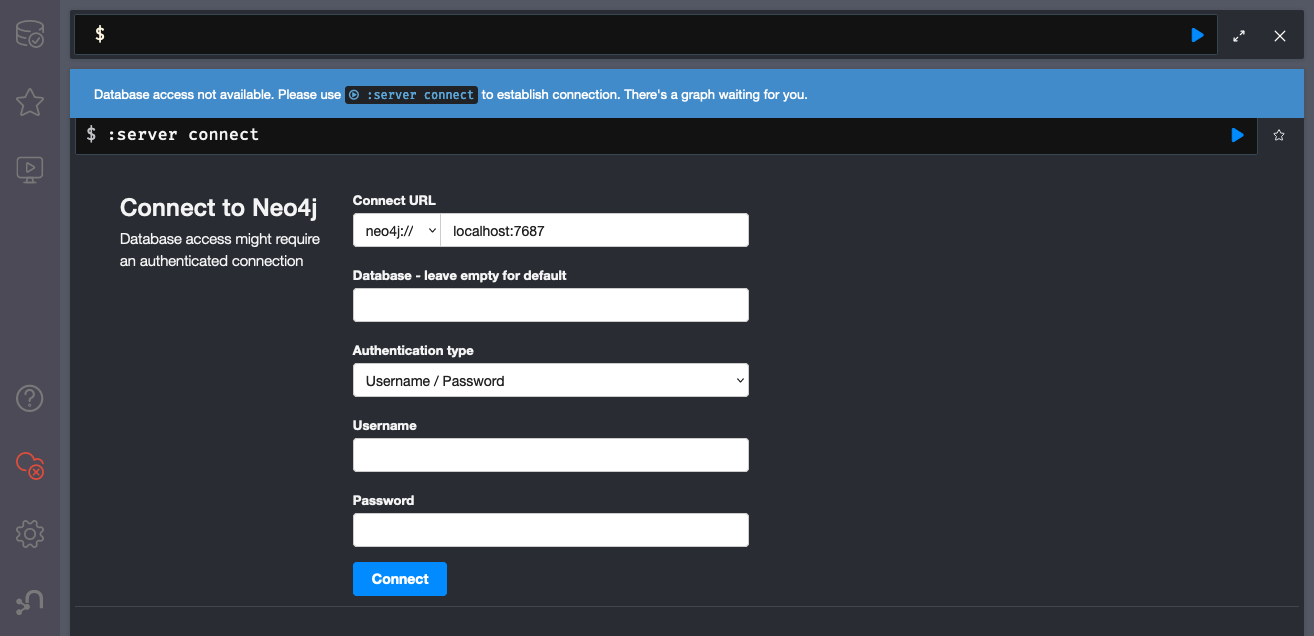
ユーザーネームとパスワード neo4j / s3cr3t に設定し,ログインすることでGUACの操作を開始できます.
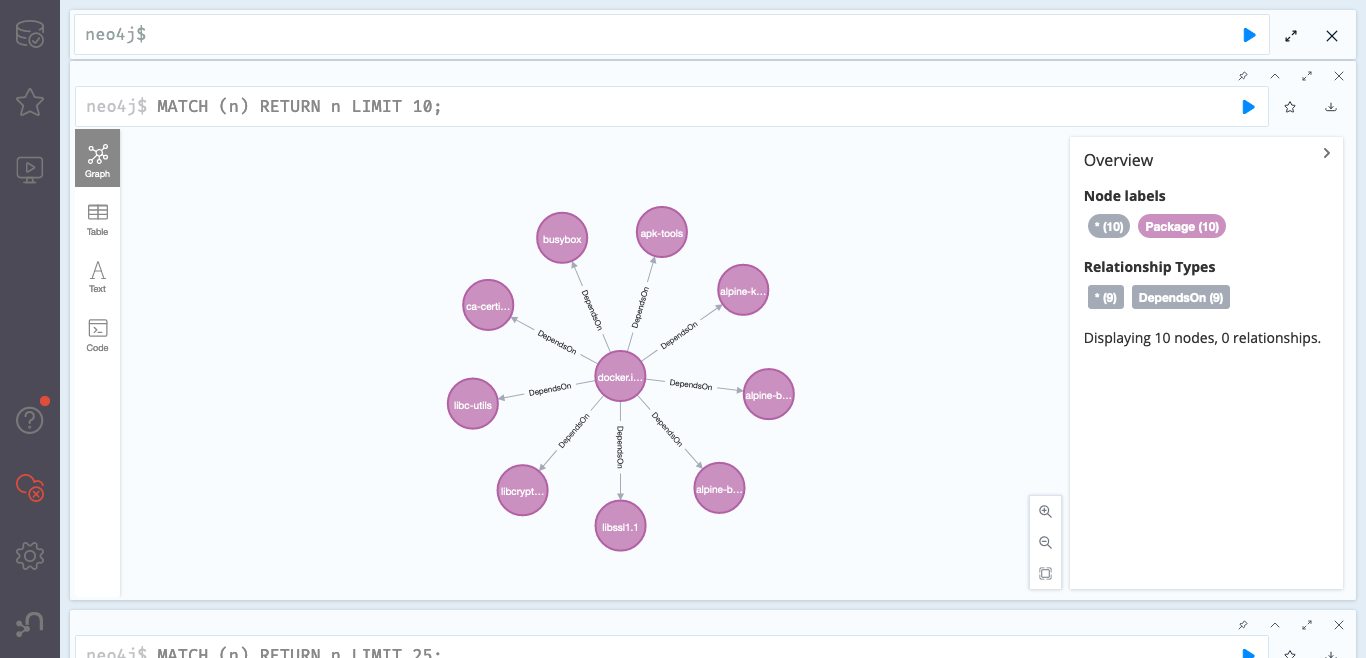
それでは早速 以下をコマンドを打って結果を表示してみましょう・
最初はGitHubのサンプルにもある以下から.(先頭25件を表示するものです。)
MATCH (n) RETURN n LIMIT 25;
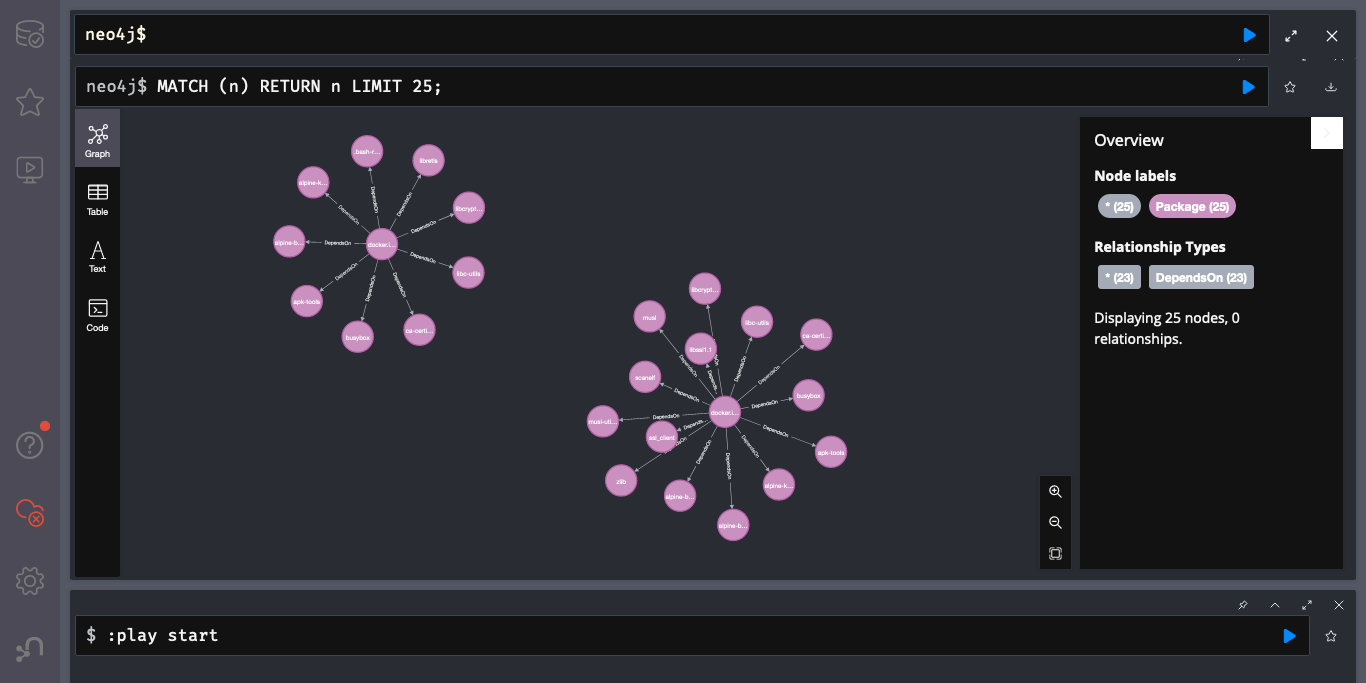
結果として上のようなネットワークが表示されます。
(下は全体を表示したものです。なお,Githubにある図は、古いデータをもとに表示されているようです。)
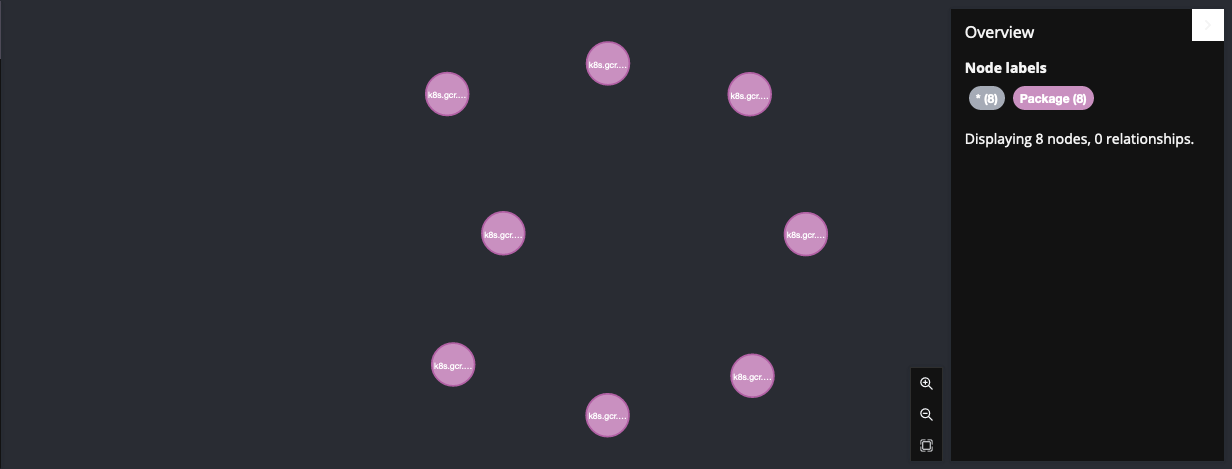
同じくGitHubにもあるサンプルコマンドを使って "kube-controller-manager" のノードを探してみましょう.
MATCH (n:Package)
WHERE n.purl CONTAINS "kube-controller-manager"
AND "CONTAINER" in n.tags
RETURN n;
なおこのGraphQLをみると,GUACはpurl すなわち,Package-URLを利用して管理をしているようですね.
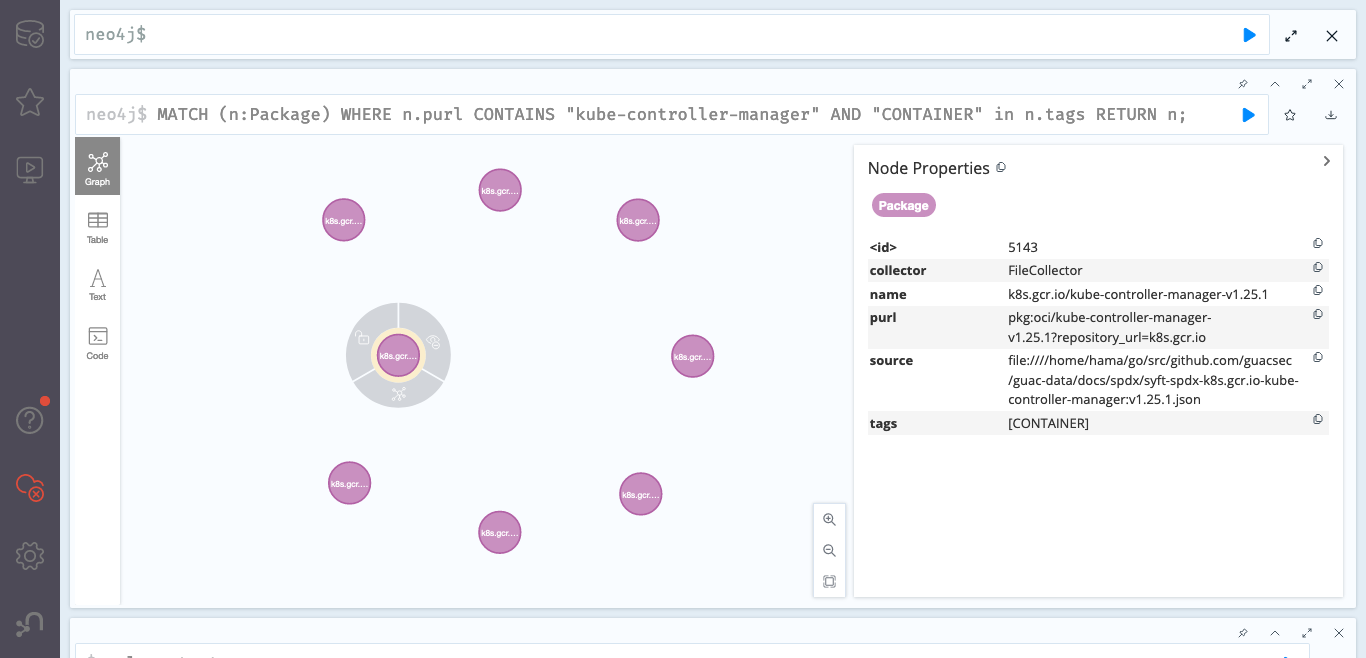
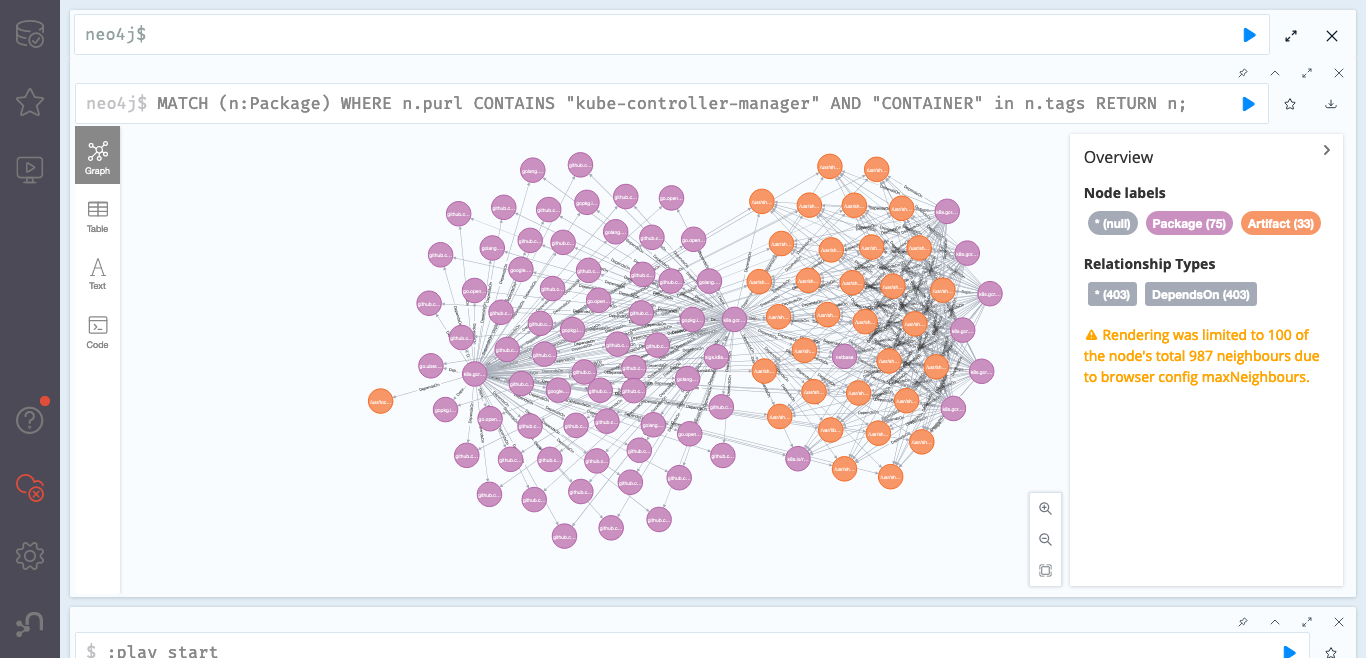
結果は以下のようになります.
そのうち1つの結果を選ぶと以下のようになります.
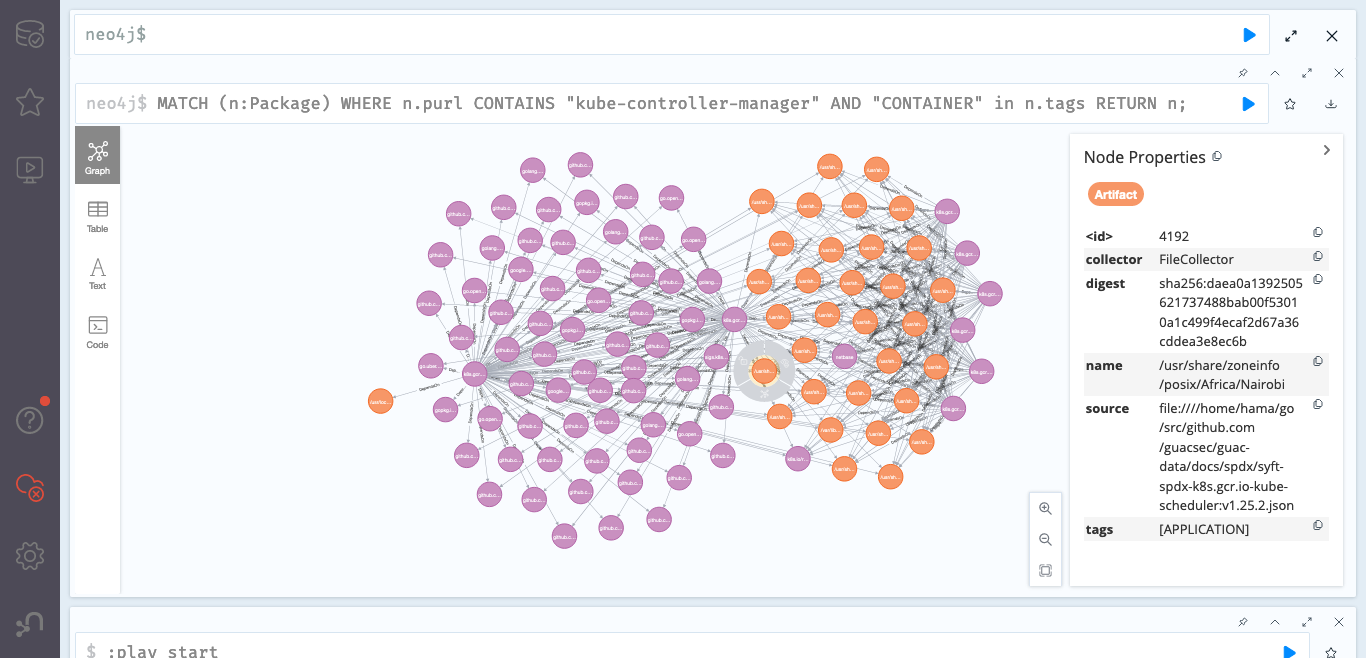
さらに丸を覆うグレーの下のボタンを押すことで,大量の依存情報が表示されます
全てを確認することはできないですが,SPDXのファイルがどこにあるかなどが確認できます.(なお,Githubの方にある図は、古いデータをもとに表示されているようです。)
今回の検証はここまでにしますが,複雑なソフトウェア情報を見やすく管理できてると思いました.今のままだと情報の活用にNeo4jの操作が必要なので,少し習得コストがかかってしまうと思います. その点も含めこれからの開発に期待です.
