環境構築後のデータ解析の部分についてのお話です。
環境構築については↓をご参照ください。
データの準備
blocksci_parser
BlockSciのディレクトリでコマンドを実行していきます。
bitcoindは停止しておくことをお勧めします。
動作したままで最新のブロックまで同期している場合にパースがうまくいかないことが多いです。
# <data-directory>にはパースデータを出力したいディレクトリを指定してください。ディレクトリが存在しない場合は自動で作成されます。
# <coin-directory>にはbitcoindで同期したブロックチェーンデータがあるフォルダを指定してください。 mainnetであれば ~/.bitcoin など
blocksci_parser --output-directory <data-directory> update disk --coin-directory <coin-directory>
注意事項
- testnetのデータはパースが出来ることは確認できていますが
jupyter notebookでデータが使用できるかは確認していません。 - regtestはソースコード内では対応しているはずですが動作検証はしていません。
clusterer
クラスターデータを使用する場合はこちらも実行します。
BlockSci環境構築(AWS編)にて初期から入っているmainnetデータでのみ動作確認しています。
また、testnetのデータではビットコインアドレスを指定してデータを取得するコードがうまく動きませんでした。
cd <data-directory>
mkdir clusters
cd clusters
clusterer ../
データ解析
最新のブロック高取得
import blocksci

chain = blocksci.Blockchain("/home/ubuntu/bitcoin/") # パースデータのディレクトリパス
height = chain[-1].height
print("ブロック高: {0}".format(height))
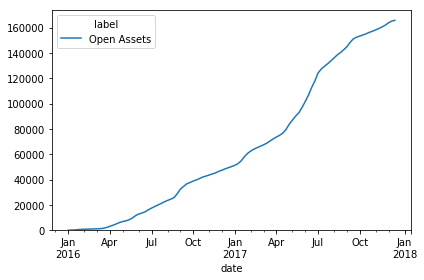
OpenAssetsトランザクション数の遷移グラフ
import blocksci
import matplotlib.pyplot as plt
import matplotlib.ticker
import collections
import pandas as pd
import numpy as np
%matplotlib notebook

chain = blocksci.Blockchain("/home/ubuntu/bitcoin/")
# OP_RETURNを含むトランザクションを全て取得
txes = chain.script_type_txes(0, len(chain), blocksci.address_type.nulldata)
# OP_RETURN payloadにOpenAssetsのバイトコードを含むものをリスト化
assets = [tx for tx in txes if tx.op_return.address.script.data[0:4] == b'OA\x01\x00']
labels = [(tx.block.time, blocksci.label_application(tx)) for tx in assets]

df = pd.DataFrame([x for x in labels], columns=["date", "label"])
df = df.reset_index().groupby(["date", "label"]).count().unstack(level=-1).fillna(0)
df.columns = df.columns.droplevel()
important_columns = list(df[df.index > pd.to_datetime("1-1-2016")].sum().sort_values()[-10:].index)
important_columns = [x for x in important_columns if "Address" not in x]
ax = df[df.index > pd.to_datetime("1-1-2016")].cumsum().resample("w").mean()[important_columns].plot()
ax.set_ylim(0)
plt.tight_layout()
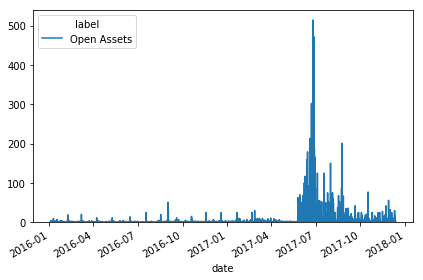
OpenAssetsIssueトランザクション数の日別グラフ
import blocksci
import matplotlib.pyplot as plt
import matplotlib.ticker
import collections
import pandas as pd
import numpy as np
%matplotlib notebook

chain = blocksci.Blockchain("/home/ubuntu/bitcoin/")
txes = chain.script_type_txes(0, len(chain), blocksci.address_type.nulldata)
assets = [tx for tx in txes if tx.op_return.address.script.data[0:4] == b'OA\x01\x00']

issues = []
for tx in assets:
    if tx.outs.all.index(tx.op_return) > 0:
        issues.append(tx)

labels = [(tx.block.time, blocksci.label_application(tx)) for tx in issues]
df = pd.DataFrame([x for x in labels], columns=["date", "label"])
df = df.reset_index().groupby(["date", "label"]).count().unstack(level=-1).fillna(0)
df.columns = df.columns.droplevel()
important_columns = list(df[df.index > pd.to_datetime("1-1-2016")].sum().sort_values()[-10:].index)
important_columns = [x for x in important_columns if "Address" not in x]
ax = df[df.index > pd.to_datetime("1-1-2016")][important_columns].plot()
ax.set_ylim(0)
plt.tight_layout()
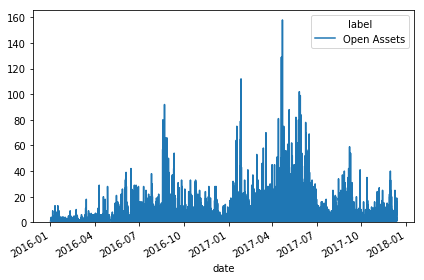
OpenAssetsTransferトランザクション数の日別グラフ
import blocksci
import matplotlib.pyplot as plt
import matplotlib.ticker
import collections
import pandas as pd
import numpy as np
%matplotlib notebook

chain = blocksci.Blockchain("/home/ubuntu/bitcoin/")
txes = chain.script_type_txes(0, len(chain), blocksci.address_type.nulldata)
assets = [tx for tx in txes if tx.op_return.address.script.data[0:4] == b'OA\x01\x00']

transfers = []
for tx in assets:
    if tx.outs.all.index(tx.op_return) == 0:
        transfers.append(tx)
    elif tx.outs.all.index(tx.op_return) > 0:
        if tx.outs.all.index(tx.op_return) < tx.op_return.address.script.data[4]:
            transfers.append(tx)

labels = [(tx.block.time, blocksci.label_application(tx)) for tx in transfers]
df = pd.DataFrame([x for x in labels], columns=["date", "label"])
df = df.reset_index().groupby(["date", "label"]).count().unstack(level=-1).fillna(0)
df.columns = df.columns.droplevel()
important_columns = list(df[df.index > pd.to_datetime("1-1-2016")].sum().sort_values()[-10:].index)
important_columns = [x for x in important_columns if "Address" not in x]
ax = df[df.index > pd.to_datetime("1-1-2016")][important_columns].plot()
ax.set_ylim(0)
plt.tight_layout()


