概要
Feature Engineeringに使用されるReliefFアルゴリズムを実装したパケージscikit-rebateを評価したので残す。
XGBoostに入れる前に予めfeatureをReliefFで減らしておくべきか、何もせずにXGBoostがstampを重ねる工程で説明変数を選ばせるべきか、XGBoostのfeature選択能力と比較しながら調べた。
- 実施期間: 2021年11月
- 環境:Colab
- パケージ:scikit-rebate, XGBoost
改版履歴:
R01: 2022年1月 "Borutaで前処理"の章を追加
ReliefFとは
特徴の相互作用に敏感なフィルター法による特徴選択を行うもの。
元々は離散的な特徴や数値特徴を持つ二値分類問題に適用するために設計された。Reliefは各特徴の特徴スコアを計算し、特徴選択の際にスコアの高い特徴をランク付けして選択することができる。また、これらのスコアは、下流のモデリングのために、特徴の重みとして適用することもできる。Reliefの特徴スコアリングは、最近傍のインスタンスペア間の特徴値の違いを識別することに基づいている。同じクラスの隣接するインスタンスペアで特徴量の違いが観察された場合(a 'hit')、特徴量のスコアは減少する。一方、クラスが異なる隣り合うインスタンスペアに特徴量の差がある場合(a 'miss')、特徴量のスコアは増加する。
その強みは、ヒューリスティックに依存しないこと、低次の多項式時間で実行されること、ノイズに強く、特徴の相互作用に頑健であること、二値データや連続データに適用できることなどであるが、冗長な特徴を識別できないこと、学習インスタンス数が少ないとアルゴリズムが誤作動することなどが挙げられる。
出典
https://en.wikipedia.org/wiki/Relief_(feature_selection)
1991年に発表されたアルゴリズムだけど、computational costが低下してきた昨今、実用化が進むようになったのかもしれない。古いアルゴリズムだから低精度ということはないので取りこぼしなくwatchしないといけない。
scikit-rebate
先述の通りReliefFとそれから派生した改良版アルゴリズム、及び反復実行ラッパーが実装されているパケージでまだ開発中のパケージ。名前の通りsckit learnのマナーで実装されているのでpiplineでモデル構築が可能となっている。
入力するfeatureはReliefFでスコアリングし、それを反復実行ラッパーTuRFが繰り返すことでfeatureを減らしていく。
ここで実装されている代表的なアルゴリズムのReliefFだが、指定可能なパラメータは下表のとおり。
| パラメータ | Default | 意味 |
|---|---|---|
| n_features_to_select | 10 | この施行におけるスコア上位数 |
| n_neighbors | 100 | 使用する近傍データ(インスタンス)の数*1 |
| discrete_threshold | 10 | featureが離散値か連続値か*2 |
| n_jobs | 1 | 並列処理数(-1:使用可能な全コア数) |
| *1) 多いほど精度が良くなるが、全インスタンスをpairwiseで距離計算するため、処理は遅くなる | ||
| *2) 例えば0,1,2の3levelで構成されているところを、>3の値で渡すと連続値とみなされ、それ以外は離散値 |
各反復施行においてTuRFのパラメータpctの比でfeature数を削減する。元論文ではスコアがマイナスなfeatureは自信を持って削減してよいらしい。本実装では処理後に出力される"top_features_"プロパティを最終的なfeatureにするのが間違いないだろうと書かれている。
TuRF via ReliefF
featureのスコアを計算しながらそれらを削減していく様子を確認する。
ReliefFとTuRFを組み合わせたスコアの求め方を示す。この例では、ロードされたdatasetがtraining datasetであると仮定しているので、ReliefFを実行する前にtrain/testに分割していない。注意点として、TuRFを使用する場合、fs.fitは引数として'headers'を必要とする。
import pandas as pd
import numpy as np
from sklearn.pipeline import make_pipeline
from skrebate.turf import TuRF
from sklearn.ensemble import RandomForestClassifier
from sklearn.model_selection import cross_val_score

genetic_data = pd.read_csv('https://github.com/EpistasisLab/scikit-rebate/raw/master/data/'
                           'GAMETES_Epistasis_2-Way_20atts_0.4H_EDM-1_1.tsv.gz',
                           sep='\t', compression='gzip')
用意されているGAMETES Epistasis(遺伝子情報データみたい)のdatasetはきれいに前処理されており、classも0,1が半々となっていた。
genetic_data.tail()
features, labels = genetic_data.drop('class', axis=1).values, genetic_data['class'].values
headers = list(genetic_data.drop("class", axis=1))
fs = TuRF(core_algorithm="ReliefF", n_features_to_select=2, pct=0.5,verbose=True)
fs.fit(features, labels, headers)
for feature_name, feature_score in zip(genetic_data.drop('class', axis=1).columns, fs.feature_importances_):
    print(feature_name, '\t', feature_score)
実行後、TuRFモデルから下記の情報を取得できる。
print(fs.headers)                     # 最終的に残ったfeature(悪い順)?
print(fs.feature_importances_)        # 全featureの最終スコア
print(fs.top_features_)               # 最後に残ったfeatureのindex(良い順)
print(fs.feature_history)             # TuRFの処理履歴
['N13', 'N0', 'N10', 'P2', 'P1']
[-0.00103125 -0.01075156 -0.01289062 -0.01289062 -0.01289062 -0.01289062
-0.01289062 -0.01289062 -0.01075156 -0.01289062 -0.00118125 -0.01289062
-0.01075156 -0.0086125 -0.01075156 -0.01289062 -0.01075156 -0.01289062
0.20529375 0.17374375]
[18, 19, 10, 0, 13]
[(['N0', 'N1', 'N2', 'N3', 'N4', 'N5', 'N6', 'N7', 'N8', 'N9', 'N10', 'N11', 'N12', 'N13', 'N14', 'N15', 'N16', 'N17', 'P1', 'P2'], array([-0.00030625, -0.00495625, -0.0094125 , -0.008 , -0.00768125,
-0.00835625, -0.01013125, -0.00959375, -0.006075 , -0.00796875,
-0.00059375, -0.008325 , -0.00691875, -0.0031625 , -0.003175 ,
-0.01020625, -0.00705 , -0.0079 , 0.1192875 , 0.12228125])), (['N16', 'N12', 'N8', 'N1', 'N14', 'N13', 'N10', 'N0', 'P1', 'P2'], array([-0.03075625, -0.03113125, -0.02639375, -0.018425 , -0.01041875,
-0.0067875 , -0.0006125 , -0.000925 , 0.17738125, 0.172475 ])), (['N13', 'N0', 'N10', 'P2', 'P1'], array([-0.0086125 , -0.00103125, -0.00118125, 0.17374375, 0.20529375]))]
特にfeature_historyを見れば各反復施行におけるスコアと、どのfeatureが削除されたかわかる。最後のタプルが最終結果となっている。
n_features_to_select=2としていたが、スコアの低いfeatureを各施行で削っていき、最終的に2個残るまで繰り返すという意味で、s.top_features_が2個になるという意味ではない。2個になるまで繰り返すのでn_features_to_selectを増やせば処理時間は短くなる(はず)。
以降、この結果をReliefFの実力として評価する。
XGBoostでBaselineの作成
まず、この遺伝子データをそのまま使ってXGBoostでモデルを作成し精度評価しておく。今回のmetricはAUCとする。
import pandas as pd
import numpy as np
import xgboost as xgb
import seaborn as sns
import matplotlib.pyplot as plt
from sklearn import model_selection
from sklearn.model_selection import train_test_split
from sklearn.metrics import accuracy_score
from sklearn.model_selection import train_test_split, GridSearchCV
from sklearn.pipeline import Pipeline
from sklearn.preprocessing import StandardScaler
from sklearn.decomposition import PCA

from xgboost import XGBClassifier
from xgboost import plot_importance
from matplotlib import pyplot

genetic_data = pd.read_csv('https://github.com/EpistasisLab/scikit-rebate/raw/master/data/'
                           'GAMETES_Epistasis_2-Way_20atts_0.4H_EDM-1_1.tsv.gz',
                           sep='\t', compression='gzip')

X = np.array(genetic_data.iloc[:,0:20])
y = np.array(genetic_data.iloc[:,20])
X_train, X_test, y_train, y_test = train_test_split(X, y, test_size=0.33, random_state=27)

def evaluation(pipeline, X, y):
    y_predict_proba = pipeline.predict_proba(X)[:, 1]
    return{
        'auc': roc_auc_score(y, y_predict_proba)
    }
下記のpipelineはココを参照した。datasetのfeature数は20なのでPCAの最大n_components数は20にしている。
model = xgb.XGBClassifier()

pipeline = Pipeline([
    ('pca', PCA()),
    ('model', model)
])

param_grid = {
    'pca__n_components': [10, 15, 20],
    'model__max_depth': [5, 7, 10, 12],
    'model__n_estimators': [200, 300, 500, 700, 1000],
    'model__learning_rate': [0.006, 0.01, 0.02],
    'model__early_stopping_rounds': [10],
}

grid = GridSearchCV(pipeline, param_grid, cv=5, n_jobs=-1, scoring='roc_auc')
fitする。
(validation dataを与えていないのでmodel__verbose=Trueは意味がない。)
grid.fit(X_train, y_train, model__verbose=True)
GridSearchCV(cv=5,
estimator=Pipeline(steps=[('pca', PCA()),
('model', XGBClassifier())]),
n_jobs=-1,
param_grid={'model__early_stopping_rounds': [10],
'model__learning_rate': [0.006, 0.01, 0.02],
'model__max_depth': [5, 7, 10, 12],
'model__n_estimators': [200, 300, 500, 700, 1000],
'pca__n_components': [10, 15, 20]},
scoring='roc_auc')
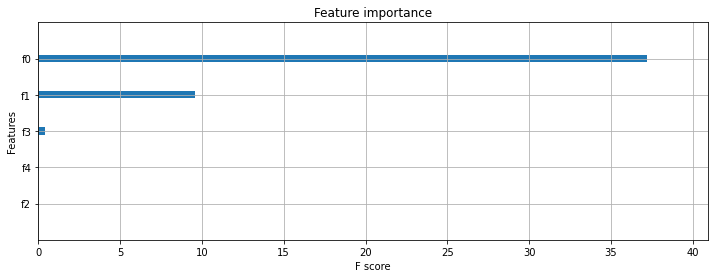
Baselineとなる精度と、XGBoostが重視したfeatureを確認する。
mean_score = grid.cv_results_["mean_test_score"][grid.best_index_]
std_score = grid.cv_results_["std_test_score"][grid.best_index_]

print(f"Best parameters: {grid.best_params_}")
print(f"Mean CV score: {mean_score: .6f}")
print(f"Standard deviation of CV score: {std_score: .6f}")

print(grid.best_estimator_.named_steps["model"].feature_importances_)

_, ax = plt.subplots(figsize=(12, 4))
plot_importance(grid.best_estimator_.named_steps["model"], ax=ax,
                importance_type='gain',
                show_values=False)
plt.show()

evaluation(grid, X_test, y_test)
Best parameters: {'model__early_stopping_rounds': 10, 'model__learning_rate': 0.01, 'model__max_depth': 12, 'model__n_estimators': 300, 'pca__n_components': 15}
Mean CV score: 0.727751
Standard deviation of CV score: 0.029997
[0.04944111 0.05100056 0.05415019 0.05358775 0.05435525 0.05538248
0.05517565 0.05723487 0.05517628 0.07368822 0.06009772 0.0695236
0.08816519 0.1196169 0.10340429]

{'auc': 0.7545162729772135}
全featureをそのまま突っ込んでもそこそこの精度が出ることが売りなので、これがXGBoostの実力である。
ちなみにReliefFとは関係ないが、このGridSearchCVで出力可能な結果は下記で確認できる。
print(grid.cv_results_.keys())
dict_keys(['mean_fit_time', 'std_fit_time', 'mean_score_time', 'std_score_time', 'param_model__early_stopping_rounds', 'param_model__learning_rate', 'param_model__max_depth', 'param_model__n_estimators', 'param_pca__n_components', 'params', 'split0_test_score', 'split1_test_score', 'split2_test_score', 'split3_test_score', 'split4_test_score', 'mean_test_score', 'std_test_score', 'rank_test_score'])
TuRF+ReliefFで前処理後、XGBoost
初めに確認しtop_features_を同じpipelineに入れてみる。ただし、feratureはすでに調整しているのでPCAはコメントアウトする。
その他共通部分を除き、結果のみ示す。
# split data into X and y
len(genetic_data.columns)
# X = np.array(genetic_data.iloc[:,18:20])
X = np.array(genetic_data.iloc[:,[18, 19, 10, 0, 13]])    # top_features_
y = np.array(genetic_data.iloc[:,20])
X_train, X_test, y_train, y_test = train_test_split(X, y, test_size=0.33, random_state=27)
pipelineの出力は下記となった。
Best parameters: {'model__learning_rate': 0.006, 'model__max_depth': 7, 'model__n_estimators': 200}
Mean CV score: 0.836071
Standard deviation of CV score: 0.036064
[7.8699720e-01 2.0307516e-01 2.9599137e-06 8.9795040e-03 9.4511727e-04]
{'auc': 0.8299218378891912}
XGBoostにfeatureを選択させたときのauc:0.7545から大きく改善している。XGBoostは中でもP1, P2に注目していることがわかる。まぁ、5個しか入れてないのでこの程度の仕事は当然。
与えたデータセットがscikit-rebateのチュートリアルのものであったこともあろうが、機械学習やっていてこんなにも精度が一気に向上することは珍しい。Baselineが悪すぎなのか?
次に元論文の通り、ReliefFスコアがプラスになったfeature(P1, P2)だけを入れてみると下記となる。
Best parameters: {'model__early_stopping_rounds': 10, 'model__learning_rate': 0.006, 'model__max_depth': 5, 'model__n_estimators': 1000}
Mean CV score: 0.847878
Standard deviation of CV score: 0.027818
[0.8596815 0.1403185]

{'auc': 0.838760058153762}
さらに改善した。
Borutaで前処理 (R01)
Feature engineeringで多用されているBourtaが選択するfeatureも確認しておく。
!pip install Boruta
from boruta import BorutaPy
from sklearn.ensemble import RandomForestClassifier

genetic_data = pd.read_csv('https://github.com/EpistasisLab/scikit-rebate/raw/master/data/'
                           'GAMETES_Epistasis_2-Way_20atts_0.4H_EDM-1_1.tsv.gz',
                           sep='\t', compression='gzip')

X = np.array(genetic_data.iloc[:,0:20])
y = np.array(genetic_data.iloc[:,20])
X_train, X_test, y_train, y_test = train_test_split(X, y, test_size=0.33, random_state=27)

rf = RandomForestClassifier(n_jobs=-1, class_weight='balanced', max_depth=5)

# define Boruta feature selection method
feat_selector = BorutaPy(rf, n_estimators='auto', verbose=2, random_state=1)

# find all relevant features - 5 features should be selected
feat_selector.fit(X_train, y_train)
どれを重要と判断したか確認する。
feat_selector.support_
array([False, False, False, False, False, False, False, False, False,
False, False, False, False, False, False, False, False, False,
True, True])
最後の2feature P1,P2を重要としている。
順位を確認する。
feat_selector.ranking_
array([18, 10, 4, 10, 3, 14, 6, 5, 15, 8, 19, 2, 12, 17, 16, 13, 7, 10, 1, 1])
P1,P2は同率1位と優劣がわからないが、ReliefFの順位は前段で確認したとおりスコアで出力されるため程度の判断が可能である。
(['N13', 'N0', 'N10', 'P2', 'P1'],
array([-0.0086125 , -0.00103125, -0.00118125, 0.17374375, 0.20529375]))
P1,P2以外はスコアがマイナスになっているため順位がBorutaのそれと全く異なってしまっている。これは仕方ない。
まとめ
まず勘違いしてはならないのは、このツールを使えばEDAが不要になるわけではないということ。人の感覚やドメイン知識でfeatureの選択を行うべきなのは言わずもがな。使用は参考程度に留めるのがよいだろう。
ただ、featureがなんなのかわからないようなデータセット、つまり単位も説明もなかったり、また次元削減済みだったりすると、使う機会は多くなるかな。それでも分布やその分布パラメータ推定、feature間の相関係数などで十分EDAは可能だが。
別のデータも入れて試しているが、パラメータのdiscrete_thresholdの使い勝手が悪い。この閾値が全featureに適用されるためlevel数が多いdiscreteなfeatureがあると対応できなくなる。Colabではなかったが自前環境では時々kernelが死亡することもある。頻繁にupdateされている開発中のパケージなのでここらへんは安定してくると思う。
以上


