HTML上に円グラフを描画する必要があって、描画してみたらしてみたで偏ったデータでラベルが重なってストレスがたまったのでその記録。
【やりたかったこと】
円グラフを描画する。
とりあえず、chart.jsで円グラフを描画してみる。
(前任者がこれを採用してたのがすべての元凶なのだろうか)
cahrt.js :https://github.com/chartjs/Chart.js/releases/tag/v2.9.3
Labelのプラグイン:https://github.com/emn178/chartjs-plugin-labels
【実装①】
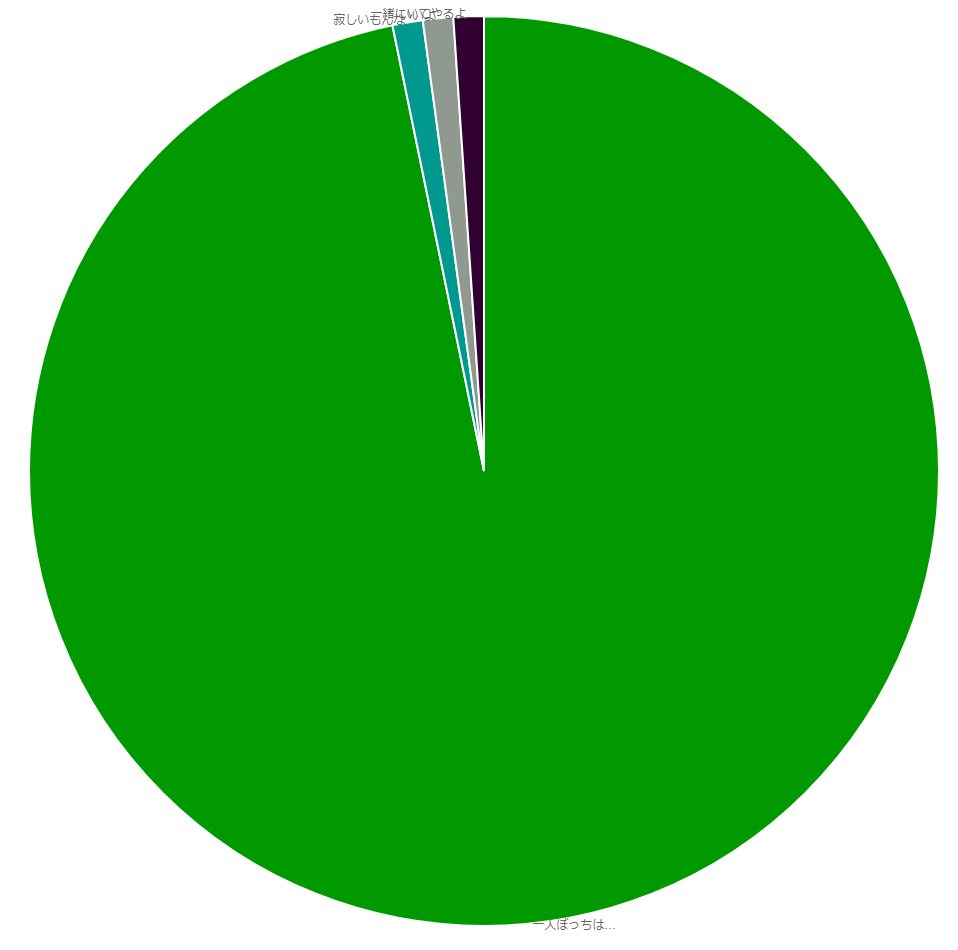
var data = {
    datasets:[{
        data:[90,1,1,1],
            backgroundColor: ["#009900","#009990","#909990","#300030"]
        }],
        labels: ["一人ぼっちは…","寂しいもんな","いいよ","一緒にいてやるよ"],
    }
    var ctx = document.getElementById('myChart').getContext('2d');
    var myPieChart = new Chart(ctx,{
        type: 'pie',
        data: data,
        options: {
            legend: {
                display: false
            },
            plugins: {
                labels: {
                    render: 'label',
                    position:'outside'
                }
            }
        }
    });
<canvas id="myChart"></canvas>
ラベルがめっちゃ被った・・・
ということで、色々と検索。
やっぱり同じようなことで悩んでる方はいるようだった。
http://danlec.com/st4k#questions/45352194
質問者が「パーフェクトだ!」みたいな返事をしている回答があったので、
さては天才だな?って思ってこの通りに実装してみた。
【実装②】
angular.module("app", ["chart.js"]).controller("ChartCtrl", function($scope) {
    $scope.labels = ["一人ぼっちは…","寂しいもんな","いいよ","一緒にいてやるよ"];
    $scope.data = [90,1,1,1];
    $scope.options = {
        pieceLabel: {
            render: 'label',
            fontColor: '#000',
            position: 'outside',
            segment: true
        }
    };
});
<div ng-app="app" ng-controller="ChartCtrl">
        <canvas id="pie" class="chart chart-pie" chart-data="data" chart-labels="labels" chart-options="options"></canvas>
</div>
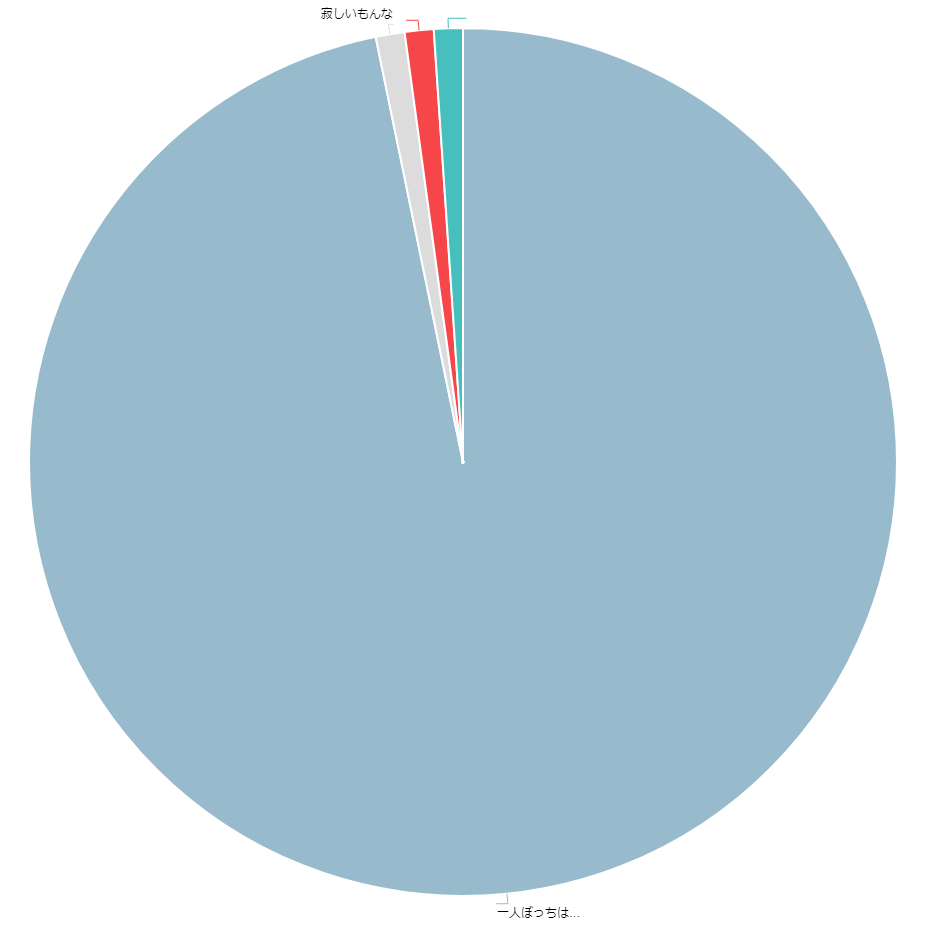
ラベル消えたが(#^ω^)ピキピキ
【解決法】
chart.jsを切り捨てて、d3.js + d3pie.js を使用する。
D3.js :https://d3js.org/
d3pie:https://github.com/benkeen/d3pie
var pie = new d3pie("myChart", {
    data: {
        content:[
            {label:"一人ぼっちは…",value:90},
            {label:"寂しいもんな",value:1},
            {label:"いいよ",value:1},
            {label:"一緒にいてやるよ",value:1}
        ]
    },
    labels:{
        percentage: {
            fontSize: 0
        }
    },
    tooltips:{
        enabled: true,
        type: "placeholder",
        string: "{label}: {value}"
    }
});
<div id="myChart"></div>
【結果】
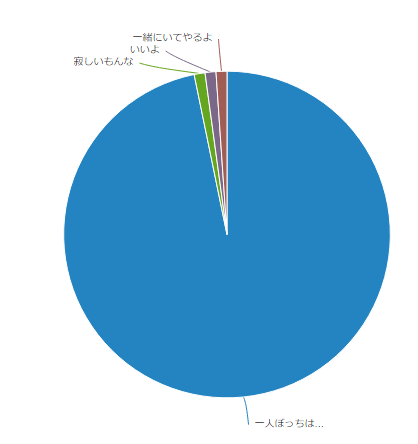
できたー(^^♪


