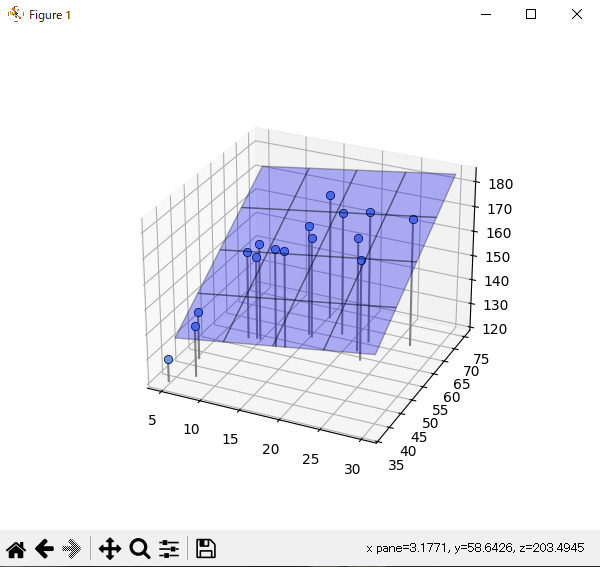
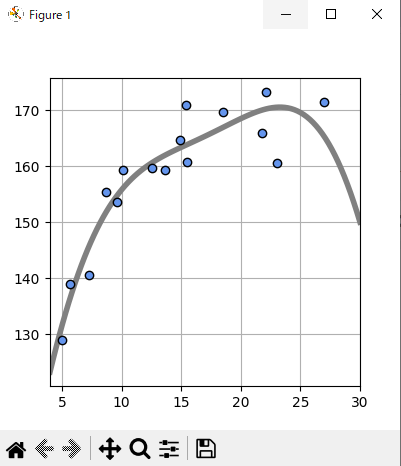
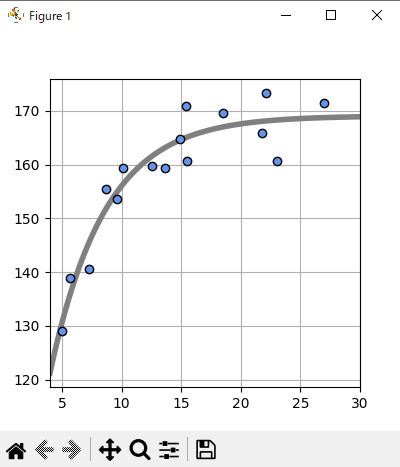
2次元入力の面モデル
年齢から身長を予測していたが、これに加えて体重のデータも使って予測する。
体重のデータはBMIが23の人を仮定して使う。
体重 = 23 × 身長^2 / 100 + noise
体重は身長の二乗に比例する式である。今回年齢をX0, 体重をX1, 身長Tとしてグラフを表示する。
import numpy as np
import matplotlib.pyplot as plt
from mpl_toolkits.mplot3d import Axes3D

np.random.seed(seed=1)              # 乱数を固定
X_min = 4                           # Xの下限値
X_max = 30                          # Xの上限値
X_n = 16                            # データ個数
X = 5 + 25 * np.random.rand(X_n)
Prm_c = [170, 108, 0.2]             # 生成パラメータ

T = Prm_c[0] - Prm_c[1] * np.exp(-Prm_c[2] * X) + 4 * np.random.randn(X_n)

X0 = X
X0_min = 5
X0_max = 30

np.random.seed(seed=1)
X1 = 23 * (T / 100)**2 + 2 * np.random.randn(X_n)
X1_min = 40
X1_max = 75

print(np.round(X0, 2))
print(np.round(X1, 2))
print(np.round(T, 2))

def show_data2(ax, x0, x1, t):
    for i in range(len(x0)):
        ax.plot([x0[i], x0[i]], [x1[i], x1[i]], [120, t[i]], color='gray')

    ax.plot(x0, x1, t, 'o', color='cornflowerblue', markeredgecolor='black', markersize=6, markeredgewidth=0.5)
    ax.view_init(elev=35, azim=-75)

# 面の表示
def show_plane(ax, w):
    px0 = np.linspace(X0_min, X0_max, 5)
    px1 = np.linspace(X1_min, X1_max, 5)
    px0, px1 = np.meshgrid(px0, px1)
    y = w[0] * px0 + w[1] * px1 + w[2]
    ax.plot_surface(px0, px1, y, rstride=1, cstride=1, alpha=0.3, color='blue', edgecolor='black')

# 面のMSE
def mse_plane(x0, x1, t, w):
    y = w[0] * x0 + w[1] * x1 + w[2]
    mse = np.mean((y - t)**2)
    return mse

# 解析解
def fit_plane(x0, x1, t):
    c_tx0 = np.mean(t * x0) - np.mean(t) * np.mean(x0)
    c_tx1 = np.mean(t * x1) - np.mean(t) * np.mean(x1)
    c_x01x1 = np.mean(x0 * x1) - np.mean(x0) * np.mean(x1)
    v_x0 = np.var(x0)
    v_x1 = np.var(x1)
    w0 = (c_tx1 * c_x01x1 - v_x1 * c_tx0) / (c_x01x1**2 - v_x0 * v_x1)
    w1 = (c_tx0 * c_x01x1 - v_x0 * c_tx1) / (c_x01x1**2 - v_x0 * v_x1)
    w2 = -w0 * np.mean(x0) - w1 * np.mean(x1) + np.mean(t)
    return np.array([w0, w1, w2])

plt.figure(figsize=(6, 5))
ax = plt.subplot(1, 1, 1, projection='3d')
W = fit_plane(X0, X1, T)
print("w0={0:.1f}, w1={1:.1f}, w2={2:.1f}".format(W[0], W[1], W[2]))

show_plane(ax, W)
show_data2(ax, X0, X1, T)
mse = mse_plane(X0, X1, T, W)
print("SD={0:.3f}".format(np.sqrt(mse)))
plt.show()
実行結果
[15.43 23.01  5.   12.56  8.67  7.31  9.66 13.64 14.92 18.47 15.48 22.13
 10.11 26.95  5.68 21.76]
[70.43 58.15 37.22 56.51 57.32 40.84 57.79 56.94 63.03 65.69 62.33 64.95
 57.73 66.89 46.68 61.08]
[170.91 160.68 129.   159.7  155.46 140.56 153.65 159.43 164.7  169.65
 160.71 173.29 159.31 171.52 138.96 165.87]
w0=0.5, w1=1.1, w2=89.0
SD=2.546
D次元線形回帰モデル
xが3次元、4次元よりも多くの次元になった場合、すべての公式を求めていると手間になる。
ここでの話が重要なポイントになる。
1次元入力で扱うのは直線モデル、2次元入力で扱うのは面モデルは、まとめて線形回帰モデルと呼ばれる同じ種類のモデル。
D次元線形回帰モデルの解は
w = (X^T X)^-1 X^T t
(X^T X)^-1 X^Tはムーアーペンローズの疑似逆行列という名前がついている。
線形基底関数モデル
基底関数は「もとになる関数」という意味。
線形回帰モデルのxを基底関数Φ(x)に置き換えることで、様々な形の関数を作るのが、線形基底関数モデルの考え方。
ガウス関数の中心位置uはモデル設計者が決めるパラメータ。
関数の広がりの程度はsで調節される。
Φ(x) = exp{-(x - u)^2 / 2 * s^2}
import numpy as np
import matplotlib.pyplot as plt

outfile = np.load('ch5_data.npz')
X = outfile['X']
X_min = outfile['X_min']
X_max = outfile['X_max']
X_n = outfile['X_n']
T = outfile['T']

# ガウス関数
def gauss(x, mu, s):
    return np.exp(-(x - mu)**2 / (2 * s**2))

# 線形基底関数モデル
def gauss_func(w, x):
    m = len(w) - 1
    mu = np.linspace(5, 30, m)
    s = mu[1]- mu[0]
    y = np.zeros_like(x)
    for j in range(m):
        y = y + w[j] * gauss(x, mu[j], s)
    y = y + w[m]
    return y

# 線形基底関数モデル MSE
def mse_gauss_func(x, t, w):
    y = gauss_func(w, x)
    mse = np.mean((y - t)**2)
    return mse

# 線形基底関数モデル 厳密解
def fit_gauss_func(x, t, m):
    mu = np.linspace(5, 30, m)
    s = mu[1] - mu[0]
    n = x.shape[0]
    psi = np.ones((n, m+1))
    for j in range(m):
        psi[:, j] = gauss(x, mu[j], s)
    psi_T = np.transpose(psi)

    b = np.linalg.inv(psi_T.dot(psi))
    c = b.dot(psi_T)
    w = c.dot(t)
    return w

# ガウス線形基底関数表示
def show_gauss_func(w):
    xb = np.linspace(X_min, X_max, 100)
    y = gauss_func(w, xb)
    plt.plot(xb, y, c=[.5, .5, .5], lw=4)

plt.figure(figsize=(4, 4))

M = 4
W = fit_gauss_func(X, T, M)
show_gauss_func(W)

plt.plot(X, T, marker='o', linestyle='None', color='cornflowerblue', markeredgecolor='black')
plt.xlim(X_min, X_max)
plt.grid(True)

mse = mse_gauss_func(X, T, W)

print('W=' + str(np.round(W, 1)))
print("SD={0:.2f} cm".format(np.sqrt(mse)))

plt.show()
実行結果
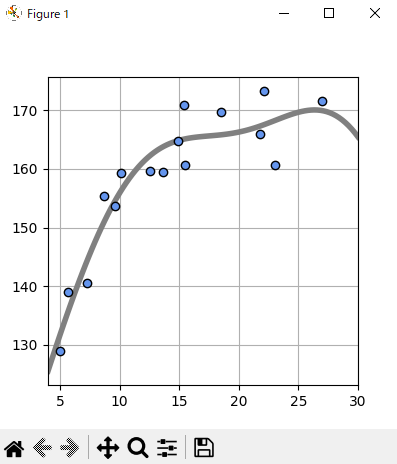
W=[29.4 75.7  2.9 98.3 54.9]
SD=3.98 cm
オーバーフィッティングの問題
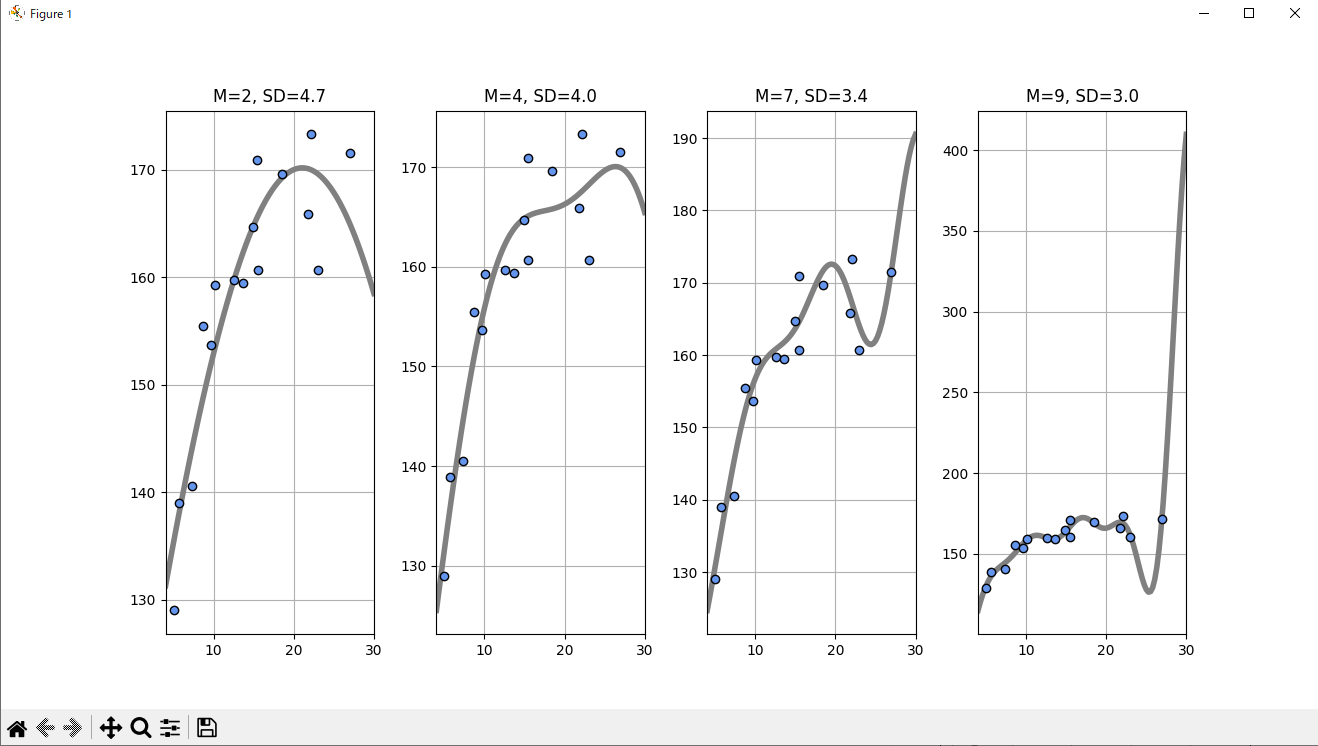
基底関数の数M, 標準偏差SDのとき、Mを大きくしていくとデータをフィッティングができるのか?
Mが増えると、誤差の標準偏差はどんどん減るが、ガウス基底関数はぐにゃぐにゃになる。
これでは新しい入力に対する予測はうまくできない。
この現象を過学習(オーバーフィッティング)という。
Mが2~9までのSDを定量的に見る。
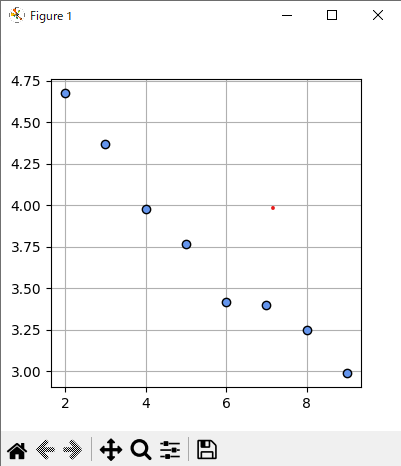
データ点に近づけば、誤差(SD)はどんどん現象していく。一方でデータ点のないところでは平均二乗誤差に関係がなくなる。
新しいデータに対する予測精度を考える。
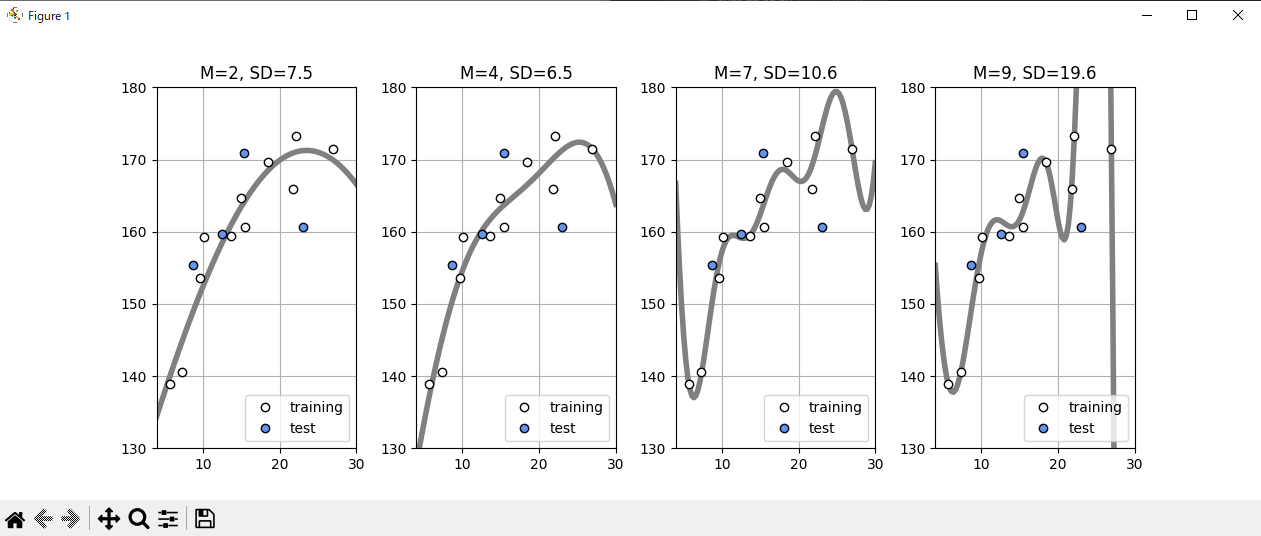
手持ちのデータXとtの1/4をテストデータとし、残りの3/4を訓練データとして分ける。
パラメータwは訓練データのみを使って最適化する。
訓練データの平均二乗誤差が最小になるパラメータwを選ぶ。
ここで決めたwを使ってテストデータの平均二乗誤差を計算し、Mを評価する。
つまり、訓練に用いなかったデータに対する予測の誤差でMを評価する。
この方法をホールドアウト検証と呼ぶ。
import numpy as np
import matplotlib.pyplot as plt

outfile = np.load('ch5_data.npz')
X = outfile['X']
X_min = outfile['X_min']
X_max = outfile['X_max']
X_n = outfile['X_n']
T = outfile['T']

# ガウス関数
def gauss(x, mu, s):
    return np.exp(-(x - mu)**2 / (2 * s**2))

# 線形基底関数モデル
def gauss_func(w, x):
    m = len(w) - 1
    mu = np.linspace(5, 30, m)
    s = mu[1]- mu[0]
    y = np.zeros_like(x)
    for j in range(m):
        y = y + w[j] * gauss(x, mu[j], s)
    y = y + w[m]
    return y

# 線形基底関数モデル MSE
def mse_gauss_func(x, t, w):
    y = gauss_func(w, x)
    mse = np.mean((y - t)**2)
    return mse

# 線形基底関数モデル 厳密解
def fit_gauss_func(x, t, m):
    mu = np.linspace(5, 30, m)
    s = mu[1] - mu[0]
    n = x.shape[0]
    psi = np.ones((n, m+1))
    for j in range(m):
        psi[:, j] = gauss(x, mu[j], s)
    psi_T = np.transpose(psi)

    b = np.linalg.inv(psi_T.dot(psi))
    c = b.dot(psi_T)
    w = c.dot(t)
    return w

# ガウス線形基底関数表示
def show_gauss_func(w):
    xb = np.linspace(X_min, X_max, 100)
    y = gauss_func(w, xb)
    plt.plot(xb, y, c=[.5, .5, .5], lw=4)

plt.figure(figsize=(4, 4))
plt.subplots_adjust(wspace=0.3)

M = [2, 4, 7, 9]
for i in range(len(M)):
    plt.subplot(1, len(M), i + 1)
    W = fit_gauss_func(X, T, M[i])
    show_gauss_func(W)
    plt.plot(X, T, marker='o', linestyle='None', color='cornflowerblue', markeredgecolor='black')
    plt.xlim(X_min, X_max)
    plt.grid(True)
    mse = mse_gauss_func(X, T, W)
    plt.title("M={0:d}, SD={1:.1f}".format(M[i], np.sqrt(mse)))

plt.show()
Mが2~9までの訓練データとテストデータのSDを定量的に見る。
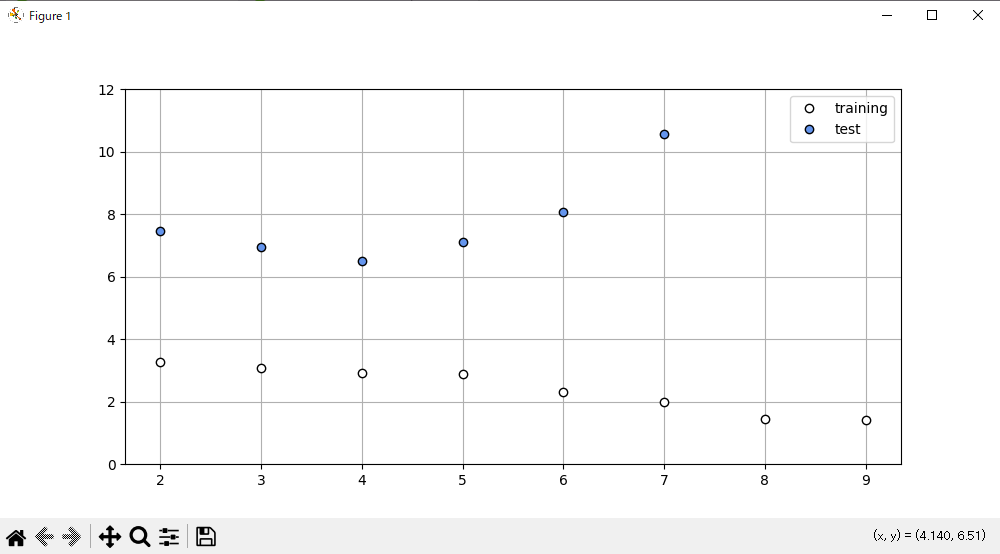
Mが5以上では過学習が発生している。
Mが4のときに最小値を取るので最適だと言える。
最適なMを選ぶことができたが、これはテストデータの選び方に依存する。
誤差の変動はデータ数が多ければ多ければほとんど起きないが、少ないときは顕著にになる。
このばらつきをできるだけ少なくする交差検証という方法を用いて、いろいろな分割で誤差を出して平均する。
データを文加圧する種類の個数でK-分割交差検証と呼ぶこともある。
import numpy as np
import matplotlib.pyplot as plt

outfile = np.load('ch5_data.npz')
X = outfile['X']
X_min = outfile['X_min']
X_max = outfile['X_max']
X_n = outfile['X_n']
T = outfile['T']

# ガウス関数
def gauss(x, mu, s):
    return np.exp(-(x - mu)**2 / (2 * s**2))

# 線形基底関数モデル
def gauss_func(w, x):
    m = len(w) - 1
    mu = np.linspace(5, 30, m)
    s = mu[1]- mu[0]
    y = np.zeros_like(x)
    for j in range(m):
        y = y + w[j] * gauss(x, mu[j], s)
    y = y + w[m]
    return y

# 線形基底関数モデル MSE
def mse_gauss_func(x, t, w):
    y = gauss_func(w, x)
    mse = np.mean((y - t)**2)
    return mse

# 線形基底関数モデル 厳密解
def fit_gauss_func(x, t, m):
    mu = np.linspace(5, 30, m)
    s = mu[1] - mu[0]
    n = x.shape[0]
    psi = np.ones((n, m+1))
    for j in range(m):
        psi[:, j] = gauss(x, mu[j], s)
    psi_T = np.transpose(psi)

    b = np.linalg.inv(psi_T.dot(psi))
    c = b.dot(psi_T)
    w = c.dot(t)
    return w

# ガウス線形基底関数表示
def show_gauss_func(w):
    xb = np.linspace(X_min, X_max, 100)
    y = gauss_func(w, xb)
    plt.plot(xb, y, c=[.5, .5, .5], lw=4)

# k分割交差検証
def kfold_gauss_func(x, t, m, k):
    n = x.shape[0]
    mse_train = np.zeros(k)
    mse_test = np.zeros(k)
    for i in range(0, k):
        x_train = x[np.fmod(range(n), k) != i]
        t_train = t[np.fmod(range(n), k) != i]
        x_test = x[np.fmod(range(n), k) == i]
        t_test = t[np.fmod(range(n), k) == i]
        wm = fit_gauss_func(x_train, t_train, m)
        mse_train[i] = mse_gauss_func(x_train, t_train, wm)
        mse_test[i] = mse_gauss_func(x_test, t_test, wm)
    return mse_train, mse_test

M = 3
plt.figure(figsize=(4, 4))
W = fit_gauss_func(X, T, M)
show_gauss_func(W)
plt.plot(X, T, marker='o', linestyle='None', color='cornflowerblue', markeredgecolor='black')
plt.xlim(X_min, X_max)
plt.grid(True)
mse = mse_gauss_func(X, T, W)
print("SD={0:.2f} cm".format(np.sqrt(mse)))
plt.show()
SD=4.37 cm
このときのMとSDのグラフは
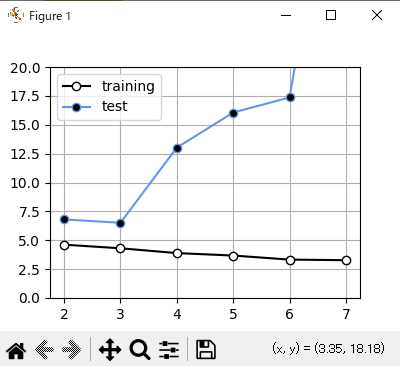
このようになり、M=3の時に最適になっていると言える。
上記の予測線においてデータの誤差は改善されたが、まだ問題点がある。
25歳のところからグラフが急激に下がっている。
これは30歳周辺のデータが不足しているから起きることである。
なので、「身長は年齢とともに徐々に増加し、ある一定のところで収束する」という知識をモデルに加える。
y(x) = w0 - w1 * exp(-w2 * x)
この式をモデルに渡す。
今までは解析解を使っていたが、今回は勾配法を使った数値解法を使う。
また、関数の最小値、最大値を求める問題は最適化問題と呼ばれ、機械学習以外の分野でも広く使われる。
import numpy as np
import matplotlib.pyplot as plt
from scipy.optimize import minimize

outfile = np.load('ch5_data.npz')
X = outfile['X']
X_min = outfile['X_min']
X_max = outfile['X_max']
X_n = outfile['X_n']
T = outfile['T']

# モデルA
def model_A(x, w):
    y = w[0] - w[1] * np.exp(-w[2] * x)
    return y

# モデルA表示
def show_model_A(w):
    xb = np.linspace(X_min, X_max, 100)
    y = model_A(xb, w)
    plt.plot(xb, y, c=[.5, .5, .5], lw=4)

# モデルAのMSE
def mse_model_A(w, x, t):
    y = model_A(x, w)
    mse = np.mean((y - t)**2)
    return mse

# モデルAのパラメータ最適化
def fit_model_A(w_init, x, t):
    res1 = minimize(mse_model_A, w_init, args=(x, t), method="powell")
    return res1.x

plt.figure(figsize=(4, 4))
W_init = [100, 0, 0]
W = fit_model_A(W_init, X, T)
print("w0={0:.1f}, w1={1:.1f}, w2={2:.1f}, ".format(W[0], W[1], W[2]))
show_model_A(W)
plt.plot(X, T, marker='o', linestyle='None', color='cornflowerblue', markeredgecolor='black')
plt.xlim(X_min, X_max)
plt.grid(True)
mse = mse_model_A(W, X, T)
print("SD={0:.2f} cm".format(np.sqrt(mse)))
plt.show()
実行結果
w0=169.0, w1=113.7, w2=0.2,
SD=3.86 cm
これでもっともらしい形になる。
