はじめに
PysimpleGUIを使った画像処理表示のデモを作成したので、覚えとして記載します。
作成したデモ
(1)OpenCVでカメラから画像を受け取りリアルタイムで、ヒストグラムを表示するプログラム
参考:
PysimpleGUIを用いたOpenCVのカメラ画像表示
(2)OpenCVで静止画を読み込み、閾値を設定するプログラム
参考:
PySimpleGUIで画像処理ビューアーを作る
[PythonでUSBカメラの映像を取り込み、ヒストグラム(RGB)をリアルタイムに表示する方法](PythonでUSBカメラの映像を取り込み、ヒストグラム(RGB)をリアルタイムに表示する方法 – Tomoblog (tomomai.com))
[PythonでGUI画面を作る方法::PySimpleGUIでグリッド表示機能のついたキャプチャ画面を作る](PythonでGUI画面を作る方法::PySimpleGUIでグリッド表示機能のついたキャプチャ画面を作る – Tomoblog (tomomai.com))
(3)OpenCVで静止画を読み込み、ROIを設定するプログラム
PysimpleGUIでは、画像表示にはCanvasを使う方法と、sg.Imageを使う方法がありますが、今回はsg.Imageを利用します。sg.Imageでは、png形式のBytesデータ渡さなければなりません。どのプログラムも、画像が読み込まれたから後の処理を行うため、Flagを用意して条件分岐しています。
参考:
Python/OpenCVのROI抽出!領域の切り出しとコピー
動作環境
Windows10 64bit
Anaconda
python 3.7
OpenCV 4.2.0 (conda-forge からインストール)
(1) OpenCVでカメラから画像を受け取りリアルタイムで、ヒストグラム表示
先ずOpenCVでリアルタイムで画像を受け取るプログラム
import cv2
import numpy as np
import PySimpleGUI as sg


sg.theme('LightBlue')

layout = [
        [sg.Text('Realtime movie', size=(40, 1), justification='center', font='Helvetica 20',key='-status-')],
        [sg.Text('Camera number: ', size=(8, 1)), sg.InputText(default_text='0',  size=(4, 1),key='-camera_num-')],
        [sg.Image(filename='', key='image')],
        [sg.Button('Start', size=(10, 1), font='Helvetica 14',key ='-start-'),
            sg.Button('Stop', size=(10, 1), font='Helvetica 14',key = '-stop-'),
            sg.Button('Exit', size=(10, 1), font='Helvetica 14', key='-exit-'), ]
        ]


window = sg.Window('Realtime movie',layout, location=(100, 100))


recording = False

while True:
    event, values = window.read(timeout=20)
    if event in (None, '-exit-'):
        break

    elif event == '-start-':
        window['-status-'].update('Live')
        camera_number = int(values['-camera_num-'])
        cap = cv2.VideoCapture(camera_number, cv2.CAP_DSHOW)
        # cap = cv2.VideoCapture(camera_number)
        recording = True

    elif event == '-stop-':
        window['-status-'].update("Stop")
        recording = False
        # 幅、高さ 戻り値Float
        W = int(cap.get(cv2.CAP_PROP_FRAME_WIDTH))
        H = int(cap.get(cv2.CAP_PROP_FRAME_HEIGHT))
        # print(H,W)
        img = np.full((H, W), 0)
        # ndarry to bytes
        imgbytes = cv2.imencode('.png', img)[1].tobytes()
        window['image'].update(data=imgbytes)
        cap.release()
        cv2.destroyAllWindows()

    if recording:
        ret, frame = cap.read()
        if ret is True:
            imgbytes = cv2.imencode('.png', frame)[1].tobytes()
            window['image'].update(data=imgbytes)

window.close()
実行例
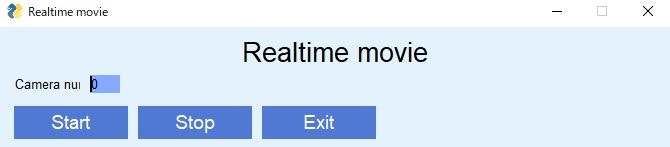
Startボタンを押すとカメラが作動します。
カメラ番号は各自の環境で変更してください。
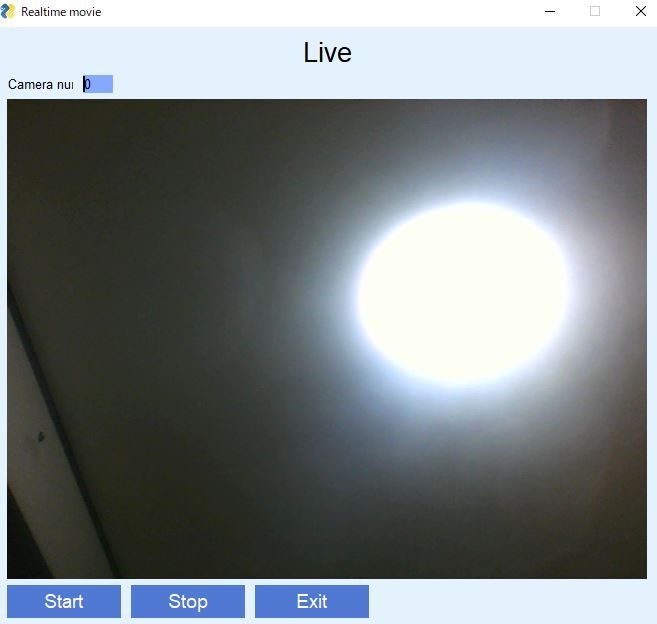
家の中が汚いので天井を写しています。
Stopで停止して、Exitでプログラムは終了します。
このプログラムに画像から、ヒストグラムを作成してそれを表示するプログラムを追加します。
import io
import cv2
import numpy as np
from matplotlib import pyplot as plt

import PySimpleGUI as sg


def draw_plot(img_f):

    histgram = cv2.calcHist([img_f], [0], None, [256], [0, 256])
    plt.figure(figsize=(5, 5))
    plt.plot(histgram)
    plt.xlim([0, 256])
    plt.title('Histgram')
    item = io.BytesIO()
    plt.savefig(item, format='png')
    plt.clf()

    ### RuntimeWarning: More than 20 figures have been opened.
    # Figures created through the pyplot interface (`matplotlib.pyplot.figure`)
    # are retained until explicitly closed and may consume too much memory.
    # (To control this warning, see the rcParam `figure.max_open_warning`).
    # このエラーが出るため plt.close('all')を追加
    plt.close('all')

    return item.getvalue()


sg.theme('LightBlue')

layout = [
        [sg.Text('Realtime movie', size=(40, 1), justification='center', font='Helvetica 20',key='-status-')],
        [sg.Text('Camera number: ', size=(8, 1)), sg.InputText(default_text='0',  size=(4, 1),key='-camera_num-')],
        [sg.Image(filename='', key='image'), sg.Image(filename='', key='-hist_img-')],
        [sg.Button('Start', size=(10, 1), font='Helvetica 14',key ='-start-'),
            sg.Button('Stop', size=(10, 1), font='Helvetica 14',key = '-stop-'),
            sg.Button('Exit', size=(10, 1), font='Helvetica 14', key='-exit-'), ]
        ]


window = sg.Window('Realtime movie with histgram',layout, location=(100, 100))

recording = False

while True:
    event, values = window.read(timeout=20)
    if event in (None, '-exit-'):
        break

    elif event == '-start-':
        window['-status-'].update('Live')
        camera_number = int(values['-camera_num-'])
        cap = cv2.VideoCapture(camera_number, cv2.CAP_DSHOW)
        # cap = cv2.VideoCapture(camera_number)
        recording = True

    elif event == '-stop-':
        window['-status-'].update("Stop")
        recording = False
        # 幅、高さ 戻り値Float
        W = int(cap.get(cv2.CAP_PROP_FRAME_WIDTH))
        H = int(cap.get(cv2.CAP_PROP_FRAME_HEIGHT))
        # print(H,W)
        img = np.full((H, W), 0)
        # ndarry to bytes
        imgbytes = cv2.imencode('.png', img)[1].tobytes()
        window['image'].update(data=imgbytes)
        cap.release()
        cv2.destroyAllWindows()

    if recording:
        ret, frame = cap.read()
        if ret is True:
            imgbytes = cv2.imencode('.png', frame)[1].tobytes()
            window['image'].update(data=imgbytes)

            histbytes = draw_plot(frame)
            window['-hist_img-'].update(data=histbytes)

window.close()
draw_plot関数ではヒストグラムと図を作成して、BytesIO()にPNG形式で書き込みます。
BytesIOに書き込んだら作った図は削除します。
plt.close() だけではメモリが解放されない場合がある
これを行うわないと画像の更新がどんどん遅くなっていきます。
実行例
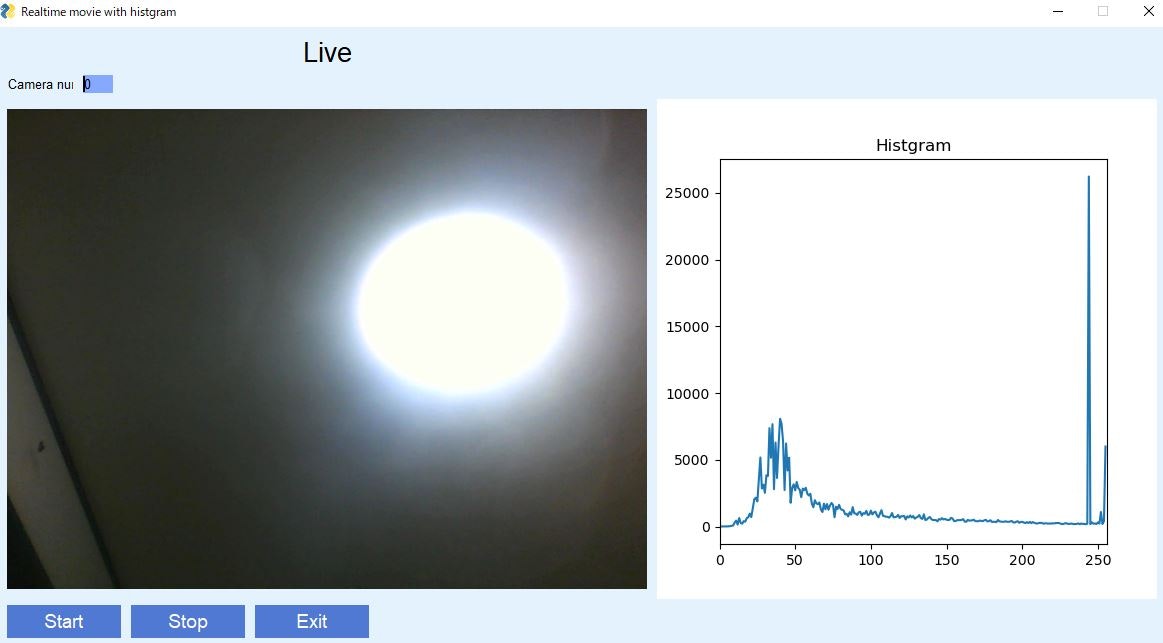
Live画像はカラーですが、ヒストグラムはグレースケールです。
リアルタイムにヒストグラムが変化します。
(2) OpenCVで静止画を読み込み、閾値設定
import datetime
import io
from pathlib import Path

import cv2
import numpy as np
from matplotlib import pyplot as plt
import PySimpleGUI as sg


def draw_plot(img_f):

    histgram = cv2.calcHist([img_f], [0], None, [256], [0, 256])
    plt.figure(figsize=(5,2))
    plt.plot(histgram)
    plt.xlim([0, 256])

    item = io.BytesIO()
    plt.savefig(item, format='png')
    plt.clf()
    plt.close('all')

    return item.getvalue()


original_image = [[sg.Image(filename='', key='-orginal_img-')]]
modify_image = [[sg.Image(filename='', key='-modify_img-')]]

# read
read_layout = [[sg.Text("File"), sg.InputText(key='-input_file-', enable_events=True, ),
                sg.FileBrowse('FileBrowse', key='-file-', target="-input_file-",), sg.Button('Read File', key='-read_file-')],
                [sg.Button('Save',key='-save-'),sg.Cancel()],
                [sg.Slider((0, 255), 0, 1, orientation='h', key='-THRESH SLIDER-'),
                sg.InputText(default_text='0',size=(5,1),key='-thslid-')]]

# hist
hist_graph = [[sg.Image(filename='', key='-hist_img-')]]


layout_tot= [[sg.Frame(title='Read',layout=read_layout),sg.Frame(title='Histgram',layout=hist_graph)],
             [sg.Frame(title='Original',layout=original_image),sg.Frame(title='Results',layout=modify_image),]]


# flag
READ_File = False

sg.theme('Dark Blue 3')

window = sg.Window('Threshold', layout_tot,
                   location=(10, 10),alpha_channel=1.0,
                   no_titlebar=False,grab_anywhere=False).Finalize()

while True:

    event, values = window.read(timeout=20)

    if event in (None, 'Cancel'):
        break

    elif event == '-read_file-':

        read_path = Path(values['-input_file-'])
        # print(read_path)
        read_img = cv2.imread(str(read_path), cv2.IMREAD_GRAYSCALE)
        imgbytes = cv2.imencode('.png', read_img)[1].tobytes()
        mod_img = read_img.copy()
        histbytes = draw_plot(read_img)
        window['-orginal_img-'].update(data=imgbytes)
        window['-modify_img-'].update(data=imgbytes)
        window['-hist_img-'].update(data=histbytes)
        window['-THRESH SLIDER-'].update(128)
        READ_File = True

    if READ_File:
        if event == '-save-':
            out_path = f'{read_path.stem}_r.png'
            cv2.imwrite(out_path, mod_img)

        # elif event == '-THRESH SLIDER-':
        elif values['-THRESH SLIDER-'] :
            _, mod_img  = cv2.threshold(read_img, int(values['-THRESH SLIDER-']), 255, cv2.THRESH_BINARY)
            mod_imgbytes = cv2.imencode('.png', mod_img)[1].tobytes()
            window['-modify_img-'].update(data=mod_imgbytes)
            window['-thslid-'].Update(int(values['-THRESH SLIDER-']))

window.close()
実行例
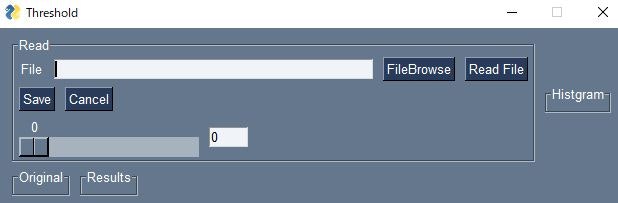
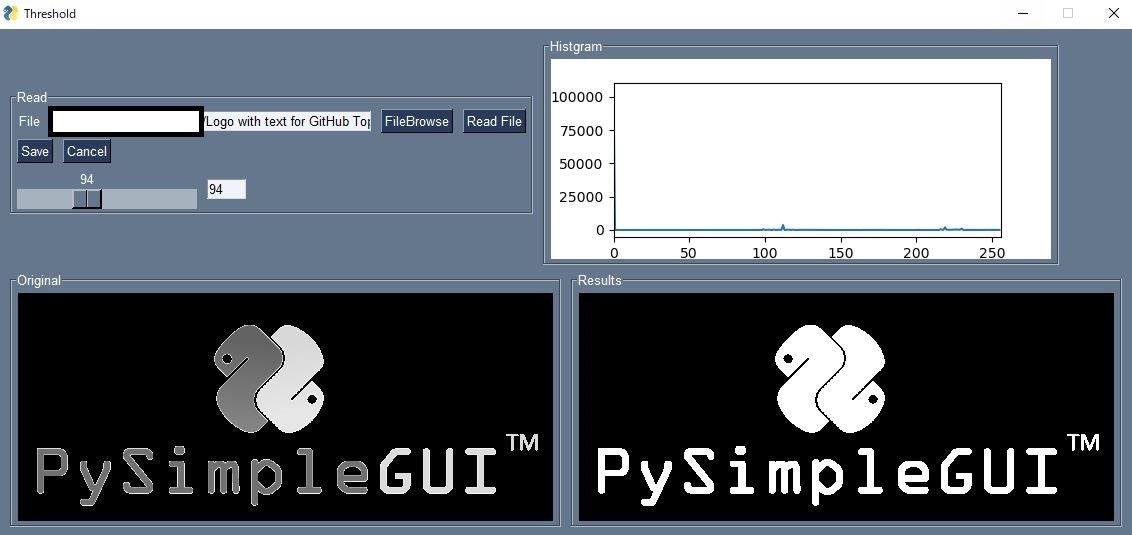
File Browseを押してRead Fileを押すと画像が読み込まれてヒストグラムが表示されます。スライダーを動かすと閾値が動き右側画像の白黒が変わります。
(3) OpenCVで静止画を読み込み、ROI設定
"""
ROI Set
"""
from pathlib import Path

import cv2
import numpy as np
from matplotlib import pyplot as plt
import PySimpleGUI as sg


def cordinate_one(g1_xy, wh):
    """
    g1_xy: tuple: Coordinate at Left-Top

    """
    g1_lt = g1_xy
    g1_rb = (g1_lt[0]+wh[0], g1_lt[1]+wh[1])

    return ((g1_lt, g1_rb), )


def cordinate_four(g1_xy, g4_xy, wh):
    """
  4つのROIの座標を計算
    g1_xy: tuple:  the Coordinate at Left-Top of Left-Top ROI
    g4_xy: tuple:  the Coordinate at Left-Top of Right-Bottom ROT
    wh : tuple

    """
    g1_lt = g1_xy
    g1_rb = (g1_lt[0]+wh[0], g1_lt[1]+wh[1])

    g4_lt = g4_xy
    g4_rb = (g4_lt[0]+wh[0], g4_lt[1]+wh[1])

    g2_lt = (g4_xy[0], g1_xy[1])
    g2_rb = (g2_lt[0]+wh[0], g2_lt[1]+wh[1])

    g3_lt = (g1_xy[0], g4_xy[1])
    g3_rb = (g3_lt[0]+wh[0], g3_lt[1]+wh[1])

    g_total = ((g1_lt, g1_rb), (g2_lt, g2_rb), (g3_lt, g3_rb), (g4_lt, g4_rb))
    return g_total


original_image = [[sg.Image(filename='', key='-orginal_img-')]]

read_layout = [[sg.Text("File"), sg.InputText(key='-input_file-', enable_events=True, ),
                sg.FileBrowse('FileBrowse', key='-file-', target="-input_file-"), sg.Button('Read File', key='-read_file-')],
               [],
               [sg.Button('Save',key='-save-'),sg.Cancel()]]

# ROI
# radio button
ROI = [[sg.Text("Size", size=(16, 1),key ='-imgsize-')],
       [sg.Radio('4 ROI Set', "RADIO1", default=False,
                     size=(8, 1), key='-roi4-')],
       [sg.Text("LT x"), sg.InputText(default_text='150', size=(5, 1), key='-roi4_x-'),
        sg.Text("LT y"), sg.InputText(default_text='150', size=(5, 1), key='-roi4_y-')],
       [sg.Text("4th LT x"), sg.InputText(default_text='350', size=(5, 1), key='-roi4_2x-'),
        sg.Text("4th LT y"), sg.InputText(
            default_text='300', size=(5, 1), key='-roi4_2y-'),
        sg.Text("WH"), sg.InputText(default_text='100', size=(5, 1), key='-roi4_wh-')],
        [sg.Radio('1 ROI Set', "RADIO1", default=True,
                     size=(8, 1), key='-roi1-')],
       [sg.Text("LT x"), sg.InputText(default_text='150', size=(5, 1), key='-roi1_x-'),
        sg.Text("LT y"), sg.InputText(
            default_text='150', size=(5, 1), key='-roi1_y-'),
        sg.Text("WH"), sg.InputText(default_text='300', size=(5, 1), key='-roi1_wh-')]]


layout_tot= [[sg.Frame(title='Read',layout=read_layout)],
             [sg.Frame(title='Image',layout=original_image),sg.Frame(title='ROI',layout=ROI)]]

sg.theme('Dark Blue 3')
window = sg.Window('ROI', layout_tot,
                   location=(10, 10),alpha_channel=1.0,
                   no_titlebar=False,grab_anywhere=False).Finalize()

read_data = False

while True:

    event, values = window.read(timeout=20)

    if event in (None, 'Cancel'):
        break

    elif event == '-read_file-':

        read_path = Path(values['-input_file-'])
        read_data = True
        read_img = cv2.imread(str(read_path), cv2.IMREAD_GRAYSCALE)
        imgbytes = cv2.imencode('.png', read_img)[1].tobytes()
        mod_img = read_img.copy()
        window['-orginal_img-'].update(data=imgbytes)
        window['-imgsize-'].update(f'Size HW:{read_img.shape}')


    if read_data:
        if values['-roi4-']:
            try:
                f1_xy = (int(values['-roi4_x-']), int(values['-roi4_y-']))
                f4_xy = (int(values['-roi4_2x-']), int(values['-roi4_2y-']))
                wh = (int(values['-roi4_wh-']), int(values['-roi4_wh-']))
            except:
                #values['-roi4_wh-']が空欄になったときにエラーになるのを避けるため
                f1_xy = (150,150)
                f4_xy =(300,300)
                wh = (50,50)
            cord_lists = cordinate_four(g1_xy=f1_xy, g4_xy=f4_xy, wh=wh)

            mod_img = read_img.copy()
            for i ,j in cord_lists:
                rect_img = cv2.rectangle(mod_img,i,j,(255,255,255),1)

            rect_img_imgbytes = cv2.imencode('.png', rect_img)[1].tobytes()
            window['-orginal_img-'].update(data=rect_img_imgbytes)

        elif values['-roi1-']:
            try:
                f1_xy = (int(values['-roi1_x-']), int(values['-roi1_y-']))
                wh = (int(values['-roi1_wh-']), int(values['-roi1_wh-']))

            except:
                f1_xy = (150, 150)
                wh = (50, 50)

            cord_lists = cordinate_one(g1_xy=f1_xy, wh=wh)
            mod_img = read_img.copy()
            for i, j in cord_lists:
                rect_img = cv2.rectangle(mod_img,i,j,(255,255,255),1)
            rect_img_imgbytes = cv2.imencode('.png', rect_img)[1].tobytes()
            window['-orginal_img-'].update(data=rect_img_imgbytes)

        elif event == '-save-':
            out_path = f'{read_path.stem}_r.png'
            cv2.imwrite(out_path, mod_img)

window.close()
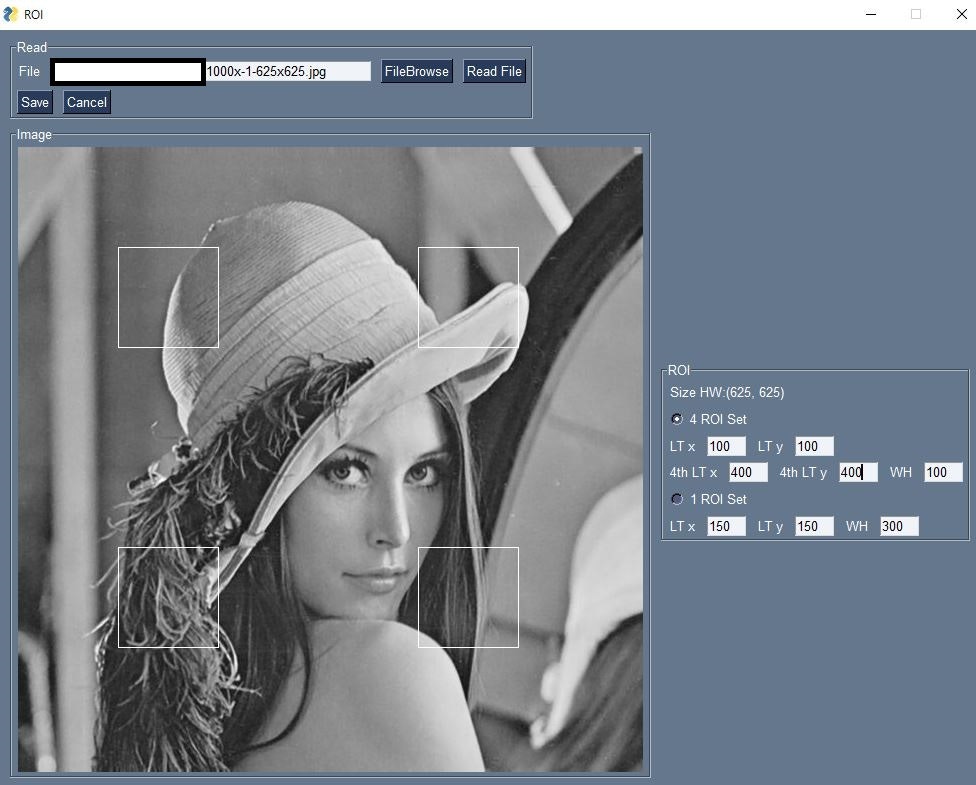
実行例
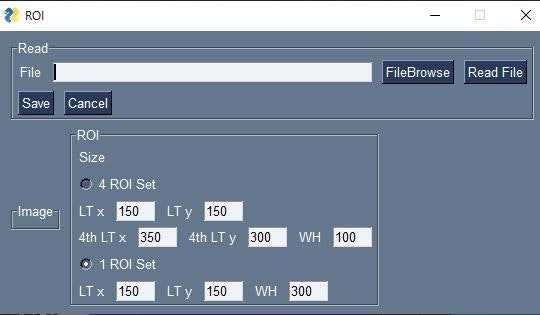

ラジオボタンを4 ROI Setに変更
まとめ
いくつかの部品(動画リアルタイム表示、画像ファイルの読み込み、ヒストグラム計算、グラフ表示、スライダーによる二値化閾値設定、ROIの座標抽出)の使いかたのデモができました。これらを組み合わせてもう少し手の込んだものを作りたいです。