時系列データの機械学習に最適(むしろ革命的に最強)のProphetを使って自分の体重変化を分析・予測してみました。
敬愛する山本義徳先生の動画で拝見した増量期とプチ減量期のサイクルを自分に合った期間で実施するための最適解を探します。
一連の実施内容と結果としてこちらに Jupyter Notebook を置いておきます。
https://github.com/GenkiOkuma/My-body-weight-analytics/blob/main/My%20Body%20Weight%20Analytics.ipynb
参考
(こちらの記事を拝読のうえProphetを実践しました。ありがとうございます。)
Google Colaboratoryで書籍「Pythonで儲かるAIをつくる」の実習コードを動かす方法
時系列予測ツールFacebook Prophetを使いPythonで様々なデータから予測をする
Prophetによる時系列データの予測
1. 体重計測
アマゾンで買った安い体重計で日々計測をする。
中国語に文字化けするけど、一応csv出力ができる。中山きんに君の動画でも見かけた。

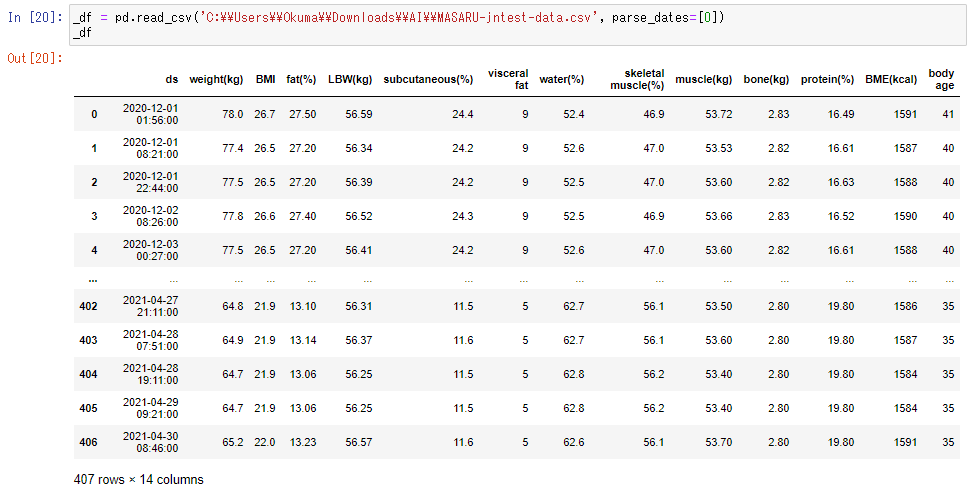
2. Jupyter Notebook の Python環境にcsvファイルを取り込む。
column名は文字化けしてたので手動でcsvファイルを編集した。体重だけでなく体脂肪率とか筋肉量とか体内年齢とかが取れる。

3. ラインチャート
df_ = df.copy()
df_ = df_.set_index('ds')
fig = plt.subplots(figsize=(20,5))
sns.lineplot(data=df_)
fig = plt.subplots(figsize=(20,5))
sns.lineplot(data=df_.resample("D").min())
fig = plt.subplots(figsize=(20,5))
sns.lineplot(data=df_.resample("W").min())
fig = plt.subplots(figsize=(20,5))
sns.lineplot(data=df_.resample("m").min())
・計測ごと

・1日の最小値

・週の最小値

・月の最小値

下記のようにやってきたつもりだが、いい感じにできていると思う。
2020年12月~2021年1月 → 減量期
2月~3月 → 増量期
4月 → 減量期
5月 → 増量期(予定)
4. 時間別の箱ひげ図
df_ = df.copy()
df_ = df_[(df_['ds'] >= datetime(2021,3,1)) & (df_['ds'] < datetime(2021,4,30))]
df_['time'] = df_['ds'].dt.hour
plt.figure(figsize=(20,6))
sns.boxplot(x="time", y="weight(kg)", data=df_,)

1日に1~3回しか計測していないのでデータが足りない。朝低くて、夜高いという程度。
5. 曜日別の箱ひげ図
df_ = df.copy()
df_ = df_[(df_['ds'] >= datetime(2021,3,1)) & (df_['ds'] < datetime(2021,4,30))]
df_ = df_.set_index('ds')
df_["day"] = df_.index.strftime("%A")
plt.figure(figsize=(20,6))
sns.boxplot(x="day", y="weight(kg)", data=df_,)

金曜日はばらつきやすい。日曜日は高くなりやすい。金曜と日曜は要注意。
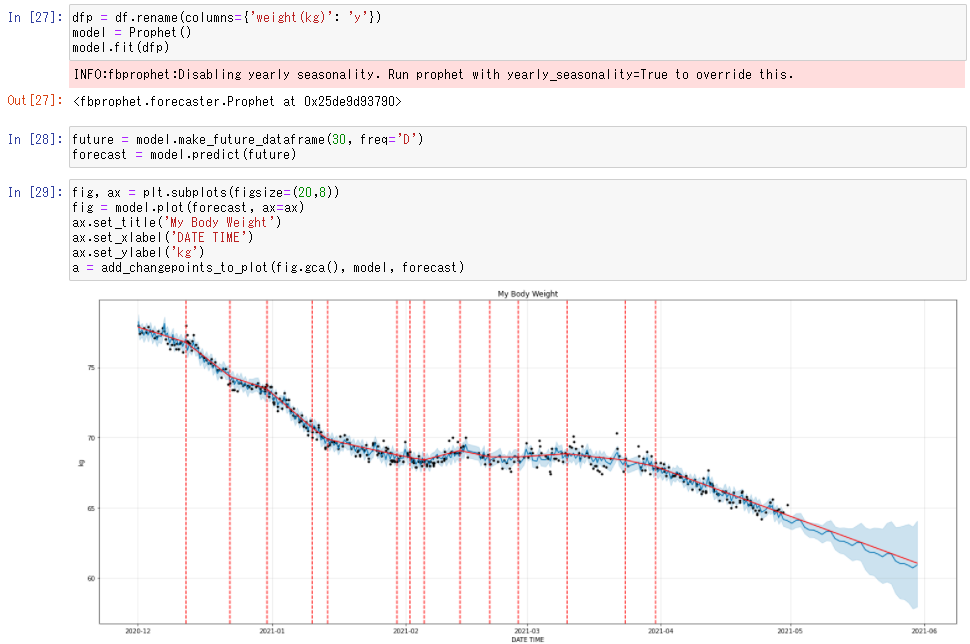
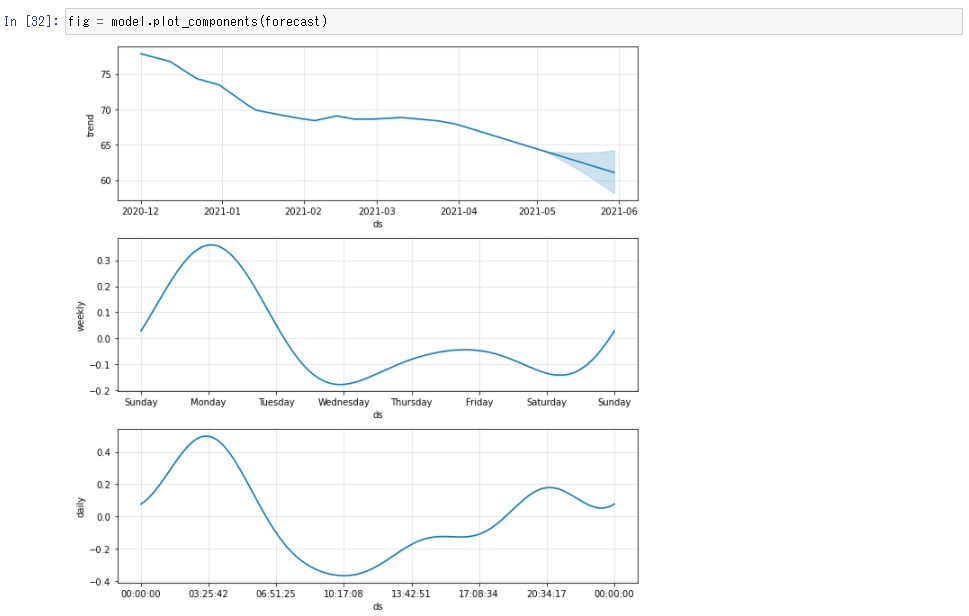
6. Prophetで分析・予測
7. Prophetで作ったmodelの誤差検証
平均誤差は2%程度と低く、精度が高い。まあ体重ってそんなに大きくブレないしね。
8. 考察
・ダイエット始めてまだ半年くらいなので、増量期と減量期の切り替えに悩みがちですが、Prophetのトレンド分析が参考になりました。
・予測がいい感じに痩せる方向を示しているのでプレッシャーになります。
・78.0kg から 64.2kg にダイエットしたわけですが、見た目はこんな感じに変化しています。
・体内年齢は実年齢 +2 から -5 に変化しました。体が変わると人生変わります。


