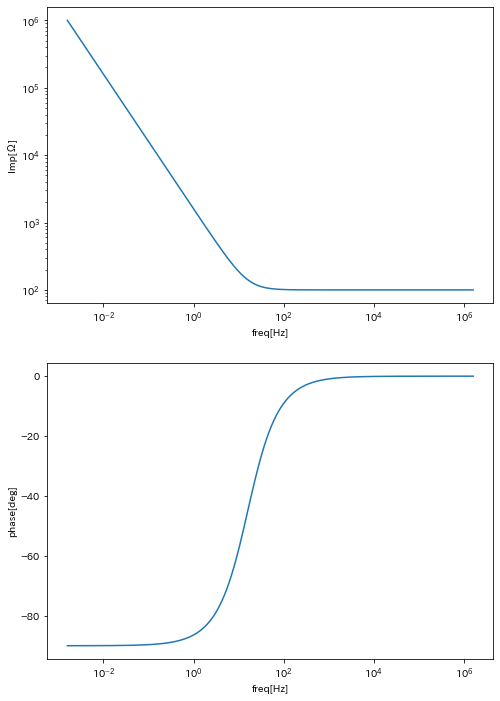
インピーダンスのグラフを書きたい
と思うことが年に1回ありますが、その度に1から調べて書いてる気がします・・・
備忘録としてプログラムを残します。
プログラム
import matplotlib.pyplot as plt
import numpy as np

import cmath
import math

r = 100
c = 100e-6
c2 = 100e-5

"""
omega = 1
z = -1/omega/c*1j + 1/(1/r + omega*c2*1j)
print(z.real)
"""

omega = np.logspace(-2,7,num = 100000)  #10^-2 ~ 10^3
#z = -1/omega/c*1j + 1/(1/r + omega*c2*1j)
z = r  -1/omega/c*1j


fz = omega / 2 /np.pi

fig = plt.figure(figsize=(8, 12))
ax1 = fig.add_subplot(2,1,1)
ax2 = fig.add_subplot(2,1,2)


ax1.plot(fz,abs(z))
ax1.set_xscale("log")
ax1.set_yscale("log")

ax1.set_xlabel("freq[Hz]")
ax1.set_ylabel("Imp[Ω]")

ax2.plot(fz,np.angle(z)*180/np.pi)
ax2.set_xscale("log")


ax2.set_xlabel("freq[Hz]")
ax2.set_ylabel("phase[deg]")

plt.show()