目的
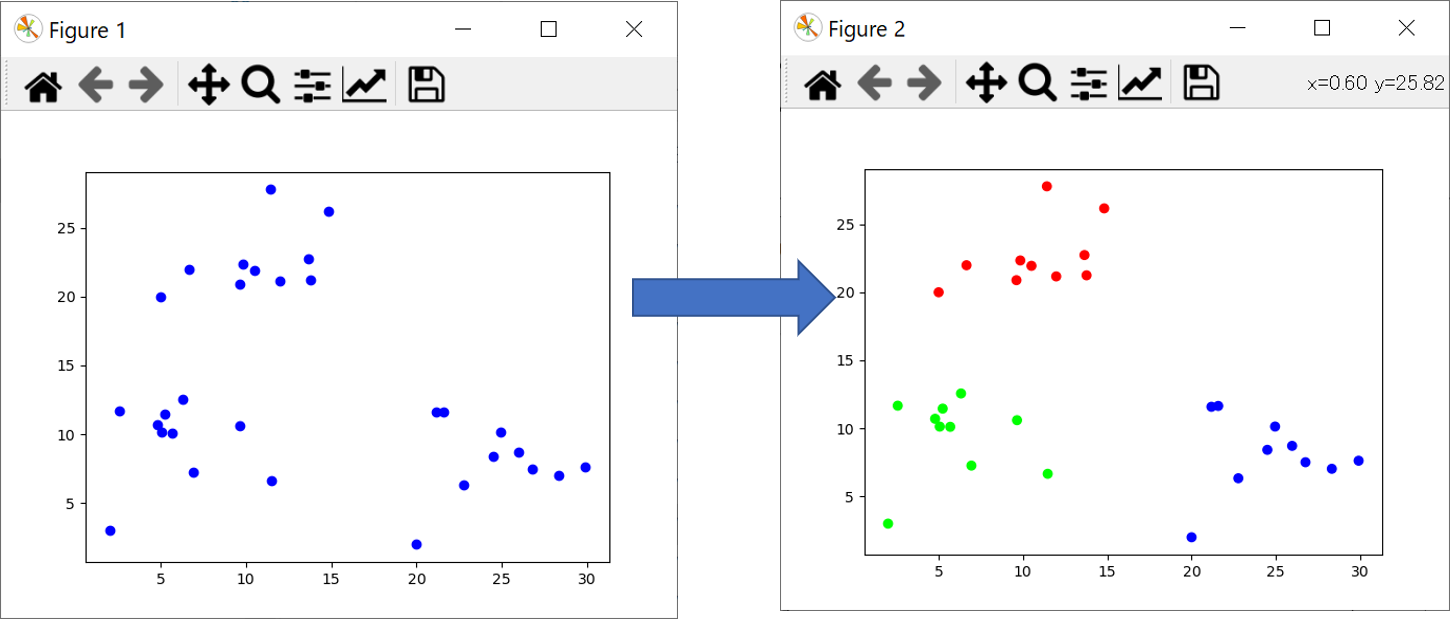
下図のようななんとなく数が3つに別れているデータを、3つに分類しその分類毎の平均値を出したかったので、ソフトを書いてみました。

コード
sklearn のKMeansを用いると色々考えなくて良さそう(参考ページ。こちらのほうが素晴らしい)
from sklearn.cluster import KMeans
import matplotlib.pyplot as plt
import pandas as pd

# close all figure
plt.close('all')

# read Initial Data
Data = pd.read_excel('kmeanData.xlsx')

plt.figure()
plt.plot(Data.x,Data.y,'bo')


# k-meansによる分類
kmeans_model = KMeans(n_clusters=3, random_state=10).fit(Data.iloc[:, 1:])

labels = kmeans_model.labels_
# 重心取得
center = kmeans_model.cluster_centers_

# 描画して確認
# それぞれに与える色を決める。
color_codes = {0:'#00FF00', 1:'#FF0000', 2:'#0000FF'}

# サンプル毎に色を与える。
colors = [color_codes[x] for x in labels]

# 色分けした Scatter Matrix を描く。
plt.figure()
plt.scatter(Data.x,Data.y,color=colors)
結果
Kmeansの出した結果と元データにしたExcelを手動分けした実平均を比較した。順番が違うだけでほぼ同じ結果が得られている。すごい。
その他
KMeans の random_state=10 のパラメータが何をしているか調べてもわからなかった。
初期クラスター位置のランダム生成に関わるパラメータなのでしょうか?
とりあえず参考にしたURLを真似ましたが、設定の考え方がわかる方がいらっしゃったら教えてほしいです。
