12
2

Delete article

Deleted articles cannot be recovered.

Draft of this article would be also deleted.

Are you sure you want to delete this article?

More than 3 years have passed since last update.

PlotJugglerでrosbagのトピックを可視化する

Last updated at Posted at 2020-11-26

PlotJugglerを用いることでrosbag中のtopicの値を横軸時間, 縦軸topic値のグラフとして可視化することができる.
また, 一度に複数のTopic値の可視化が可能. ロード時間もrqt_bagに比べて短い(と思う)
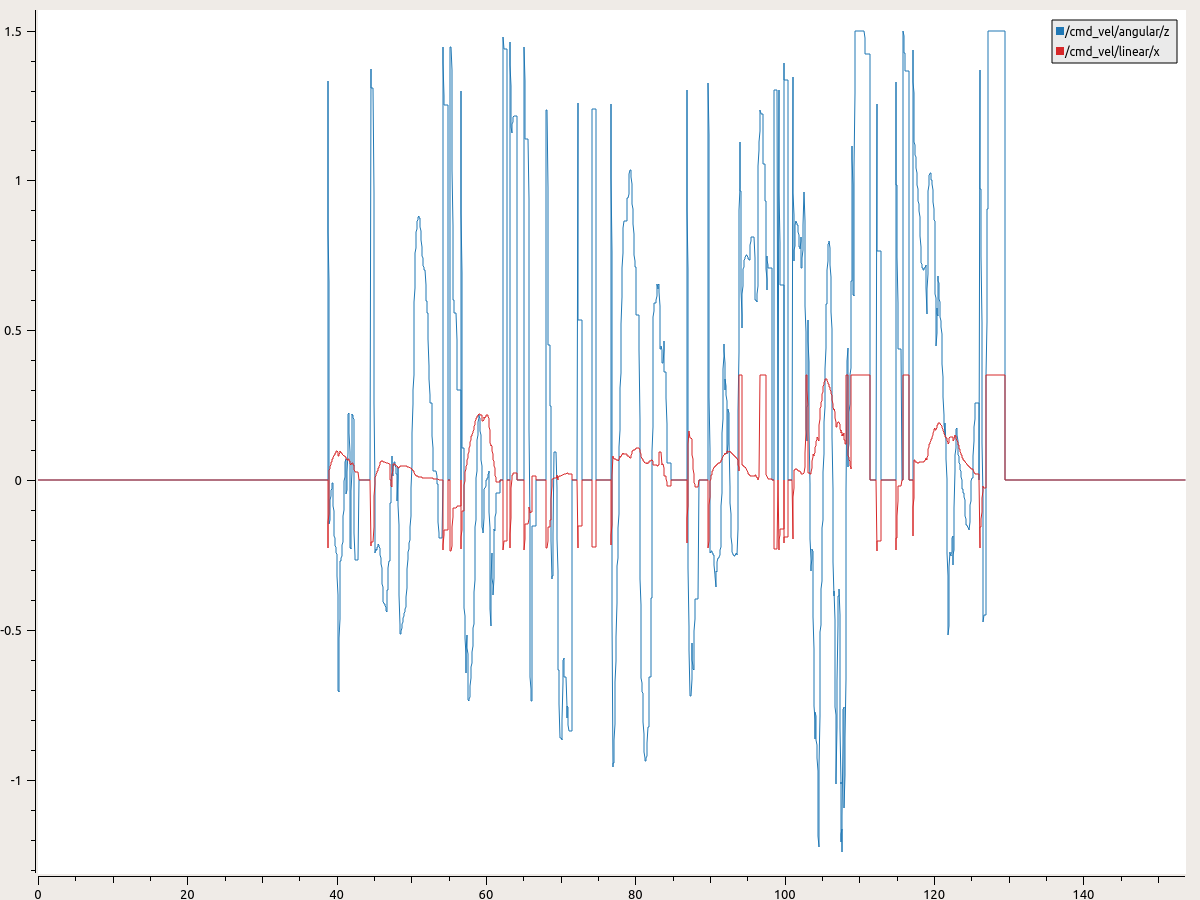
もちろん再生も可能です

PlotJugglerのインストール

こちらをインストールします
https://index.ros.org/p/plotjuggler/

以下のコマンドでplotjugglerをインストールします。ROS Pluginも同時にインストールされます。

sudo apt install ros-${ROS_DISTRO}-plotjuggler-ros

実行

以下のコマンドで実行できる

rosrun plotjuggler plotjuggler

File>Load Dataと選択し, 解析したいrosbagデータを選択するとrosbag中のTopic一覧が表示されるので, 可視化したいTopicを選択する
あとは以下のgifのように操作すればOK


http://wiki.ros.org/plotjuggler より引用

12
2
0

Register as a new user and use Qiita more conveniently

  1. You get articles that match your needs
  2. You can efficiently read back useful information
  3. You can use dark theme
What you can do with signing up
12
2

Delete article

Deleted articles cannot be recovered.

Draft of this article would be also deleted.

Are you sure you want to delete this article?