7
12

Delete article

Deleted articles cannot be recovered.

Draft of this article would be also deleted.

Are you sure you want to delete this article?

More than 5 years have passed since last update.

【Tableau10.2以降】市区町村マップを簡単に作成する

Last updated at Posted at 2017-09-08

#概要
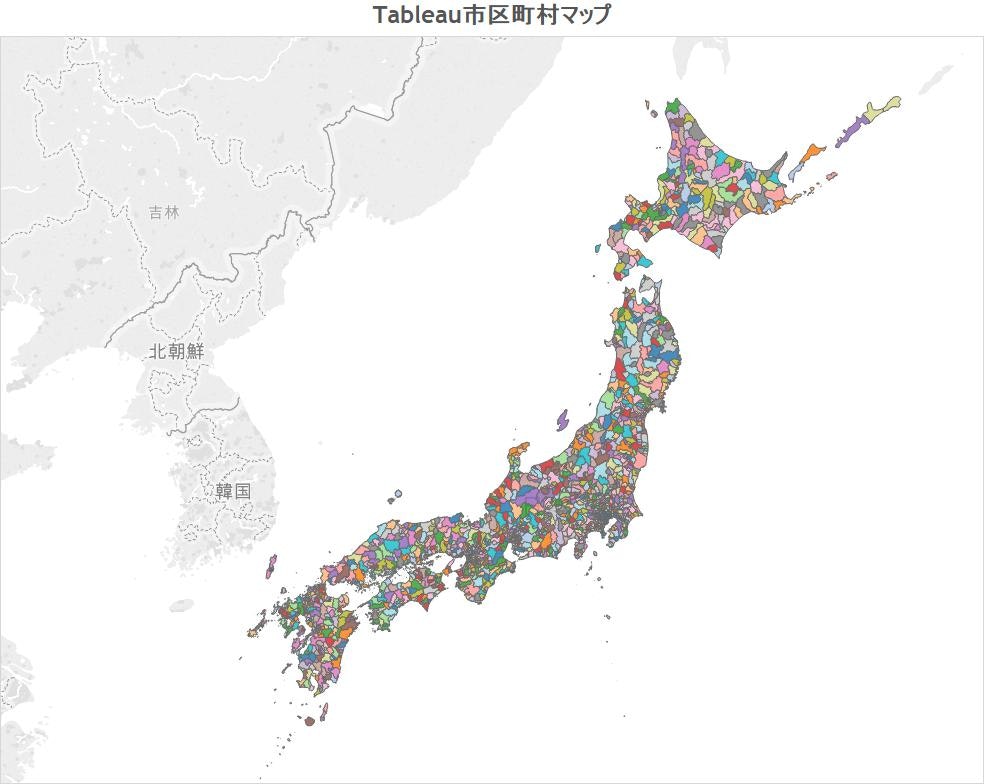
Tableauで市区町村マップの表示が簡単にできたので書いときます。
現時点ではデフォルトで都道府県、郵便番号3桁でしかマッピングできず、ググっても難しそうなやり方しか出てこなかったのですが、Tableauが空間ファイルを扱えるようになったことでかなり楽にできました。

Tableau市区町村マップ.jpg

#参考
http://qiita.com/shu_saito/items/95e96eea3a5f4e851a87

#環境
Windows10, Tableau DeskTop 10.3

#手順

  1. 国土数値情報ダウンロードサービスの「GML(JPGIS2.1)シェープファイル」から「行政区域>全国」をダウンロードする
    http://nlftp.mlit.go.jp/ksj/index.html

  2. Tableauのデータソースで「空間ファイル」を選択し、1でダウンロードした中にある.shpファイルを選択する

3.メジャーの「Geometry」をダブルクリックする

行政区意外にもいろいろな区域のデータが置いてあるので分析し放題ですね。
7
12
0

Register as a new user and use Qiita more conveniently

  1. You get articles that match your needs
  2. You can efficiently read back useful information
  3. You can use dark theme
What you can do with signing up
7
12

Delete article

Deleted articles cannot be recovered.

Draft of this article would be also deleted.

Are you sure you want to delete this article?