- 製造業出身のデータサイエンティストがお送りする記事
- 今回はクラスタリング手法の中で、K-means法を実装しました。
はじめに
前回、K-means法を実装しましたが、今回は階層的クラスタリング手法を実装してみました。
階層的クラスタリングとは
階層的クラスタリングとは、最も似ている組み合わせから順番にまとまり(クラスタ)にしていく方法です。
階層的クラスタリングの実装
pythonのコードは下記の通りです。
# 必要なライブラリーのインストール
import numpy as np
import pandas as pd

# 可視化
import matplotlib as mpl
import matplotlib.pyplot as plt
import seaborn as sns
from IPython.display import display
%matplotlib inline
sns.set_style('whitegrid')

# 正規化のためのクラス
from sklearn.preprocessing import StandardScaler

# 階層クラスタリングに必要なものをインポート
from scipy.cluster import hierarchy
最初に必要なライブラリーをimportします。
今回もirisのデータを使って実装してみようと思います。
# irisデータ
from sklearn.datasets import load_iris

# データ読み込み
iris = load_iris()
iris.keys()

df_iris = iris.data
df_target = iris.target
target_names = iris.target_names
df_labels = target_names[df_target]

# データの正規化(平均0, 標準偏差1)
scaler = StandardScaler()
df_iris_std = scaler.fit_transform(df_iris)
前処理は上記で終了です。
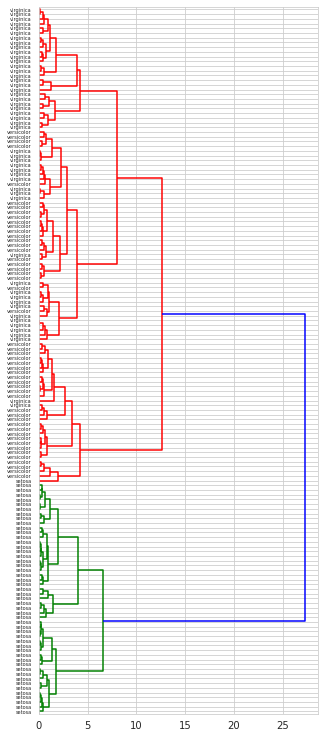
今回はウォード法を用いて階層クラスタリングを実施したいと思います。クラスタ同士の距離の定義の仕方は他にも色々ありますので、データに合わせて適切な手法を選択する必要があります。
# 距離計算
dist = hierarchy.distance.pdist(df_iris_std, metric='euclidean')

# クラスタリング
linkage = hierarchy.linkage(dist, method='ward')

# デンドログラム
fig, ax = plt.subplots(figsize=(5,13))
ax = hierarchy.dendrogram(Z=linkage,
                orientation='right',
                labels=dataset_labels)
fig.show()
さいごに
最後まで読んで頂き、ありがとうございました。
今回は、階層的クラスタリング法を実装しました。
訂正要望がありましたら、ご連絡頂けますと幸いです。