GitHub では自分のプロフィールページにここ一年の毎日のコミット状況が緑色の濃さで表示されますが、「もっと最近だけでいいから色の濃さだけでなくコミット数を一覧表示したい」「最近の自分のコミット一覧を表示したい」ということもあると思います。
GitHub API を叩けばコミット情報は取れますが、特にいくつものリポジトリで開発している場合は、それぞれのリポジトリのコミット情報を得てまとめる必要があります。そこで、各リポジトリのコミットを集めて日ごとに集計して可視化する Python スクリプトを書きました。標準ライブラリのみで動きます。
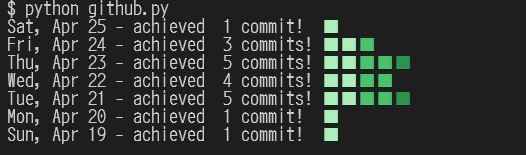
スクリプトを実行すると以下のように棒グラフ的に自分のここ 1 週間のコミット数を可視化します (集計期間は変更可能です)。
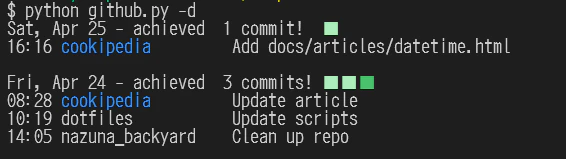
また、詳細オプション -d を付けると各日付に具体的にどのようなコミットをしたかも表示します。このとき、特定のリポジトリ名に文字色を付けることも可能です。
スクリプト
-
自分がオーナーであるリポジトリへの自分のコミットを対象とします (そうでない場合は
GitHubApi.get_reposとGitHubApi.get_commitsの修正が必要です)。 -
Personal access tokens (PAT) を発行して利用する想定です。
- 未発行の場合 Settings -> Developer Settings > Personal access tokens -> Fine-grained tokens から発行して Contents に Read 権限を付けてください。
- 発行した PAT は
if __name__ == '__main__':で pat に代入してください (下記の例では~/.himitsuにgithub_pat = "github_pat_XXXXXX..."を書いておいて読み込みますが別の方法でも構いません)。 - 対象リポジトリがパブリックリポジトリのみの場合は PAT がなくても情報取得できますが、
GitHubApi.get_reposの修正が必要です (自分のユーザ名を指定した URL に)。また、PAT なしの場合はリクエスト数が制約されます。
-
GitHubApi.get_reposとGitHubApi.get_commitsのn_maxには「集計期間にコミットするリポジトリ数はこれを超えないだろう」「集計期間で1リポジトリあたりにコミットする数はこれを超えないだろう」という数を入れてください。大きくすれば情報取得漏れを防げますが、アクセスが重くなるかもしれません。 -
Plotter.__init__で以下を制御できます。- 集計期間 (本日までの何日間を集計するか) (本日を含む)。
- 集計対象 (全てのリポジトリ / パブリックのみ / プライベートのみ)。
- タイムゾーン (各日付にグルーピングするのに必要なため)。
- リポジトリ名の文字色 (詳細表示時のみ使用)。リポジトリ名をキーとし色名を値とした辞書を渡すとリポジトリ名表示時に色を付けられます。辞書にないリポジトリ名には色は付きません。
- 以下ではその日の「1, 2 コミット目」「3, 4 コミット目」「5 コミット目以降」で緑色の濃さを分けますが、カスタマイズしたい場合は
Plotter.create_barplot(とPlotter.color) の変更が必要です。-
Plotter.colorについては端末に色付き文字を表示する ANSI エスケープシーケンスのスニペット (bash / zsh と python) も参考にしてください。
-
github.py
from datetime import datetime, timedelta, timezone
from urllib.request import Request, urlopen
from urllib.parse import urlencode
from pathlib import Path
import json
import tomllib
from collections import defaultdict
import argparse


class GitHubApi:
    def __init__(self, pat):  # pat = personal access token
        self.pat = pat  # github_pat_XXXXXX...

    def _get(self, url, params):
        req = Request(f'{url}?{urlencode(params)}')
        req.add_header('Authorization', f'Bearer {self.pat}')
        with urlopen(req) as res:
            data = json.load(res)
        return data

    def get_repos(self, visibility, n_max=20):
        url = 'https://api.github.com/user/repos'
        params = {'visibility': visibility, 'sort': 'updated', 'per_page': n_max}
        return self._get(url, params)

    def get_commits(self, owner, repo_name, since, n_max=50):
        url = f'https://api.github.com/repos/{owner}/{repo_name}/commits'
        params = {'author': owner, 'since': since, 'per_page': n_max}
        return self._get(url, params)


class Plotter:
    def __init__(self, pat, n_days=7, repo_colors=None):  # pat = personal access token
        self.gh = GitHubApi(pat)
        self.n_days = n_days
        self.visibility = 'all'  # all, public, private
        self.tz = timezone(timedelta(hours=9))  # JST
        self.set_date()
        self.repo_colors = {} if repo_colors is None else repo_colors

    def set_date(self):
        self.now = datetime.now(self.tz)
        day_since = (self.now - timedelta(days=(self.n_days - 1))).date()
        since_jst = datetime.combine(day_since, datetime.min.time(), self.tz)
        self.since = since_jst.astimezone(timezone.utc).isoformat()

    def to_dt(self, ts):
        return datetime.fromisoformat(ts.replace('Z', '+00:00')).astimezone(self.tz)

    def collect_commits(self):
        repos = self.gh.get_repos(self.visibility)
        commits_all = defaultdict(list)
        for repo in repos:
            owner = repo['owner']['login']
            repo_name = repo['name']
            commits = self.gh.get_commits(owner, repo_name, self.since)
            for c in commits:
                dt = self.to_dt(c['commit']['committer']['date'])
                commits_all[dt.date()].append({
                    'repo': repo_name, 'time': dt.strftime('%H:%M'),
                    'msg': c['commit']['message'].splitlines()[0],
                })
        return commits_all

    @staticmethod
    def dt_to_str(dt):
        dow = ['Mon', 'Tue', 'Wed', 'Thu', 'Fri', 'Sat', 'Sun'][dt.weekday()]
        return dow + ', ' + dt.strftime('%b') + ' ' + str(dt.day).rjust(2)

    @staticmethod
    def color(s, color_name):
        aes = lambda x: f'\033[{x}m'
        d = {
            'gray': 90, 'green': 92, 'yellow': 93, 'blue': 94,
            'magenta': 95, 'cyan': 96, 'yellowgreen': '38;5;76',
            'green 1': '38;2;172;238;187',
            'green 3': '38;2;74;194;107',
            'green 5': '38;2;45;146;78',
        }
        return aes(d.get(color_name, 0)) + s + aes(0)

    @staticmethod
    def create_barplot(n):
        return ' '.join([
            Plotter.color('\u25A0', 'green ' + str(1 if i <= 1 else (3 if i <= 3 else 5)))
            for i in range(n)
        ])

    def _format_repo(self, repo_name):
        return Plotter.color(repo_name.ljust(18), self.repo_colors.get(repo_name, '-'))

    def plot(self, detail):
        commits_all = self.collect_commits()
        day = self.now.date()
        for i in range(self.n_days):
            commits = sorted(commits_all[day], key=lambda c: c['time'])
            n = len(commits)
            msg = f'- achieved {n:>2} commit' + ('s!' if n != 1 else '! ') if n else ''
            print(f'{Plotter.dt_to_str(day)} {msg} {Plotter.create_barplot(n)}')
            if detail:
                for c in commits:
                    print(' '.join([c['time'], self._format_repo(c['repo']), c['msg']]))
                print()
            day -= timedelta(days=1)


if __name__ == '__main__':
    parser = argparse.ArgumentParser()
    parser.add_argument('-d', '--detail', action='store_true')
    args = parser.parse_args()

    # Get personal access token
    # github_pat = "github_pat_XXXXXX..."
    pat = tomllib.loads(
        Path('~/.himitsu').expanduser().read_text(encoding='utf8'),
    )['github_pat']

    plotter = Plotter(pat, n_days=7, repo_colors={'cookipedia': 'blue'})
    plotter.plot(args.detail)