はじめに
前回の記事(Qiita記事のタグからWordCloudを描画してみた)では、Qiita記事に付与されたタグを取得し、WordCloudを作りました。
今回は見せ方を変えて、Treemapを描画します。
最終的に、以下のようなモノを作ります。
本稿で紹介すること
- Qiita APIからの記事情報の取得
- Treemapの描画
Qiita API v2ドキュメント
TREEMAP - The Python Graph Gallery
本稿で紹介しないこと
- Pythonライブラリの使い方
- requests
- json
- collections
- pathlib
- matplotlib
- squarify ※Treemap描画用のPythonライブラリ
サンプルコード
Code量も多くないので、全体のCodeを紹介。
ポイントは3つ。
1. GETリクエストを実行する際、アクセストークンを指定
Qiita API v2ドキュメントに以下の記載があるように、アクセストークンを取得し、Codeに埋め込むのがベター。
利用制限
認証している状態ではユーザごとに1時間に1000回まで、認証していない状態ではIPアドレスごとに1時間に60回までリクエストを受け付けます。
2. イメージを描画する際、日本語対応フォントを指定
Text properties and layout - Matplotlib 3.3.0 documentationに以下の項があるように、日本語対応フォントを(適宜インストールして)指定するのがベター。
Default Font
The base default font is controlled by a set of rcParams. To set the font for mathematical expressions, use the rcParams beginning with mathtext (see mathtext).
3. 出現頻度の低い(話題性とか重要性とかの小さい)タグを前処理で除外
前回の記事(Qiita記事のタグからWordCloudを描画してみた)では、Qiita記事に付与されたタグの出現頻度を鑑みず描画しました。
そのため、極端な話、出現頻度が1回のタグも描画することになり、描画結果がごちゃごちゃした感じになっていました。
(全体を俯瞰するという観点では、出現頻度の低いタグも把握できて良いのですが。)
そこで、今回は出現頻度の低いタグを切り捨てて、スッキリした描画を目指します。
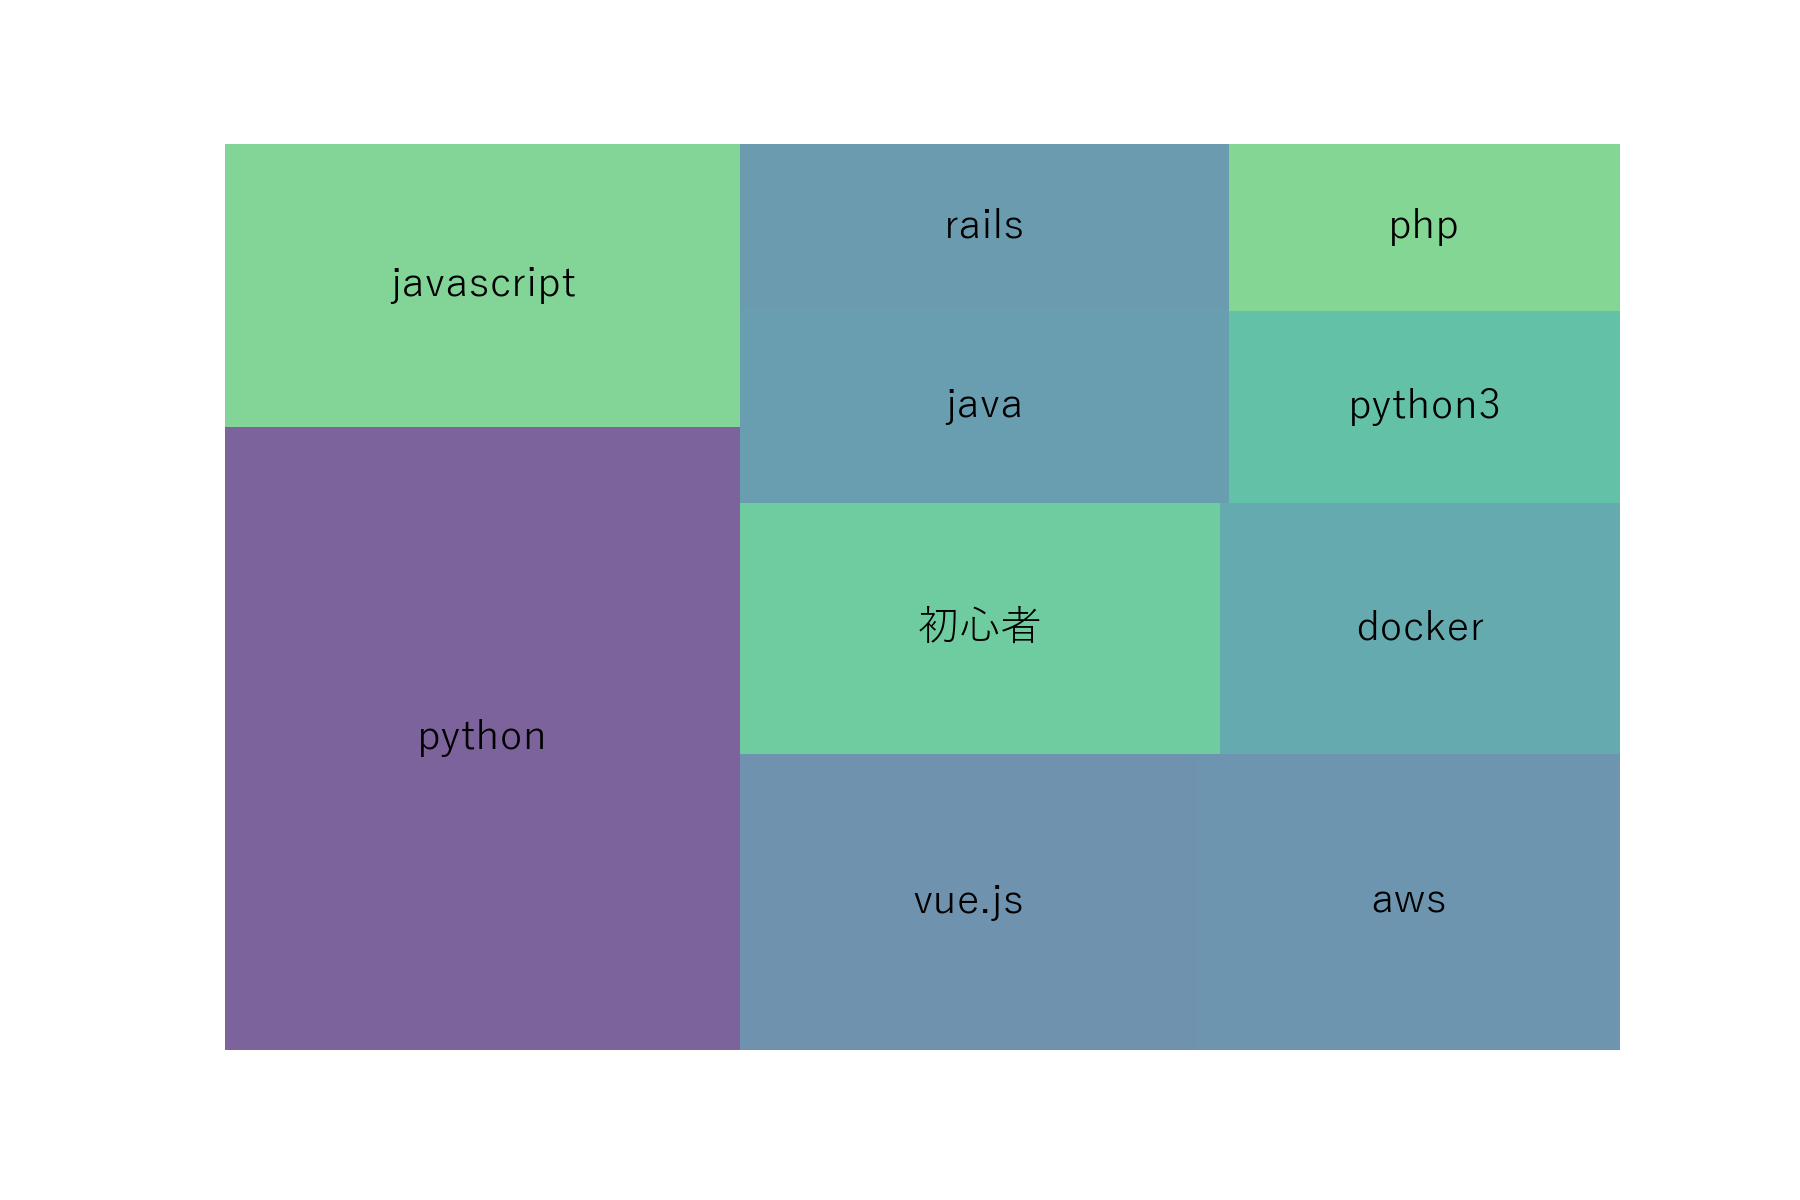
まずは、#200 Basic Treemap with pythonのサンプルコードを参考にシンプルに描画。
import requests
import json

url = 'https://qiita.com/api/v2/items?per_page=100&page='
headers = {'Authorization': 'Bearer ${YOUR ACCESS-TOKEN}'}

tags = []
for i in range(5):
    print('=====')
    print('Downloading ... ' + url + str(i+1))
    print('-----')
    #response = requests.get(url + str(i+1))
    response = requests.get(url + str(i+1), headers=headers)

    for article in json.loads(response.text):
        print(article['title'])
        tags.extend([tag['name'].lower() for tag in article['tags']])
    print('=====')

from collections import Counter

c = Counter(tags)
# print(c)

# 出現回数が多いものから順にTop10を列挙(重複なし)
tagSurface, tagCount = zip(*c.most_common(10))
print(tagSurface)
print(tagCount)

from pathlib import Path
import matplotlib.pyplot as plt
import squarify

result_dir_path = Path('..').joinpath('result')
plt.rcParams["font.family"] = 'Yu Gothic'
squarify.plot(sizes=list(tagCount), label=list(tagSurface), alpha=0.7)
plt.axis('off')
plt.savefig(result_dir_path.joinpath('trends_of_qiita_treemap1.png'), format="png", dpi=300)
plt.show()
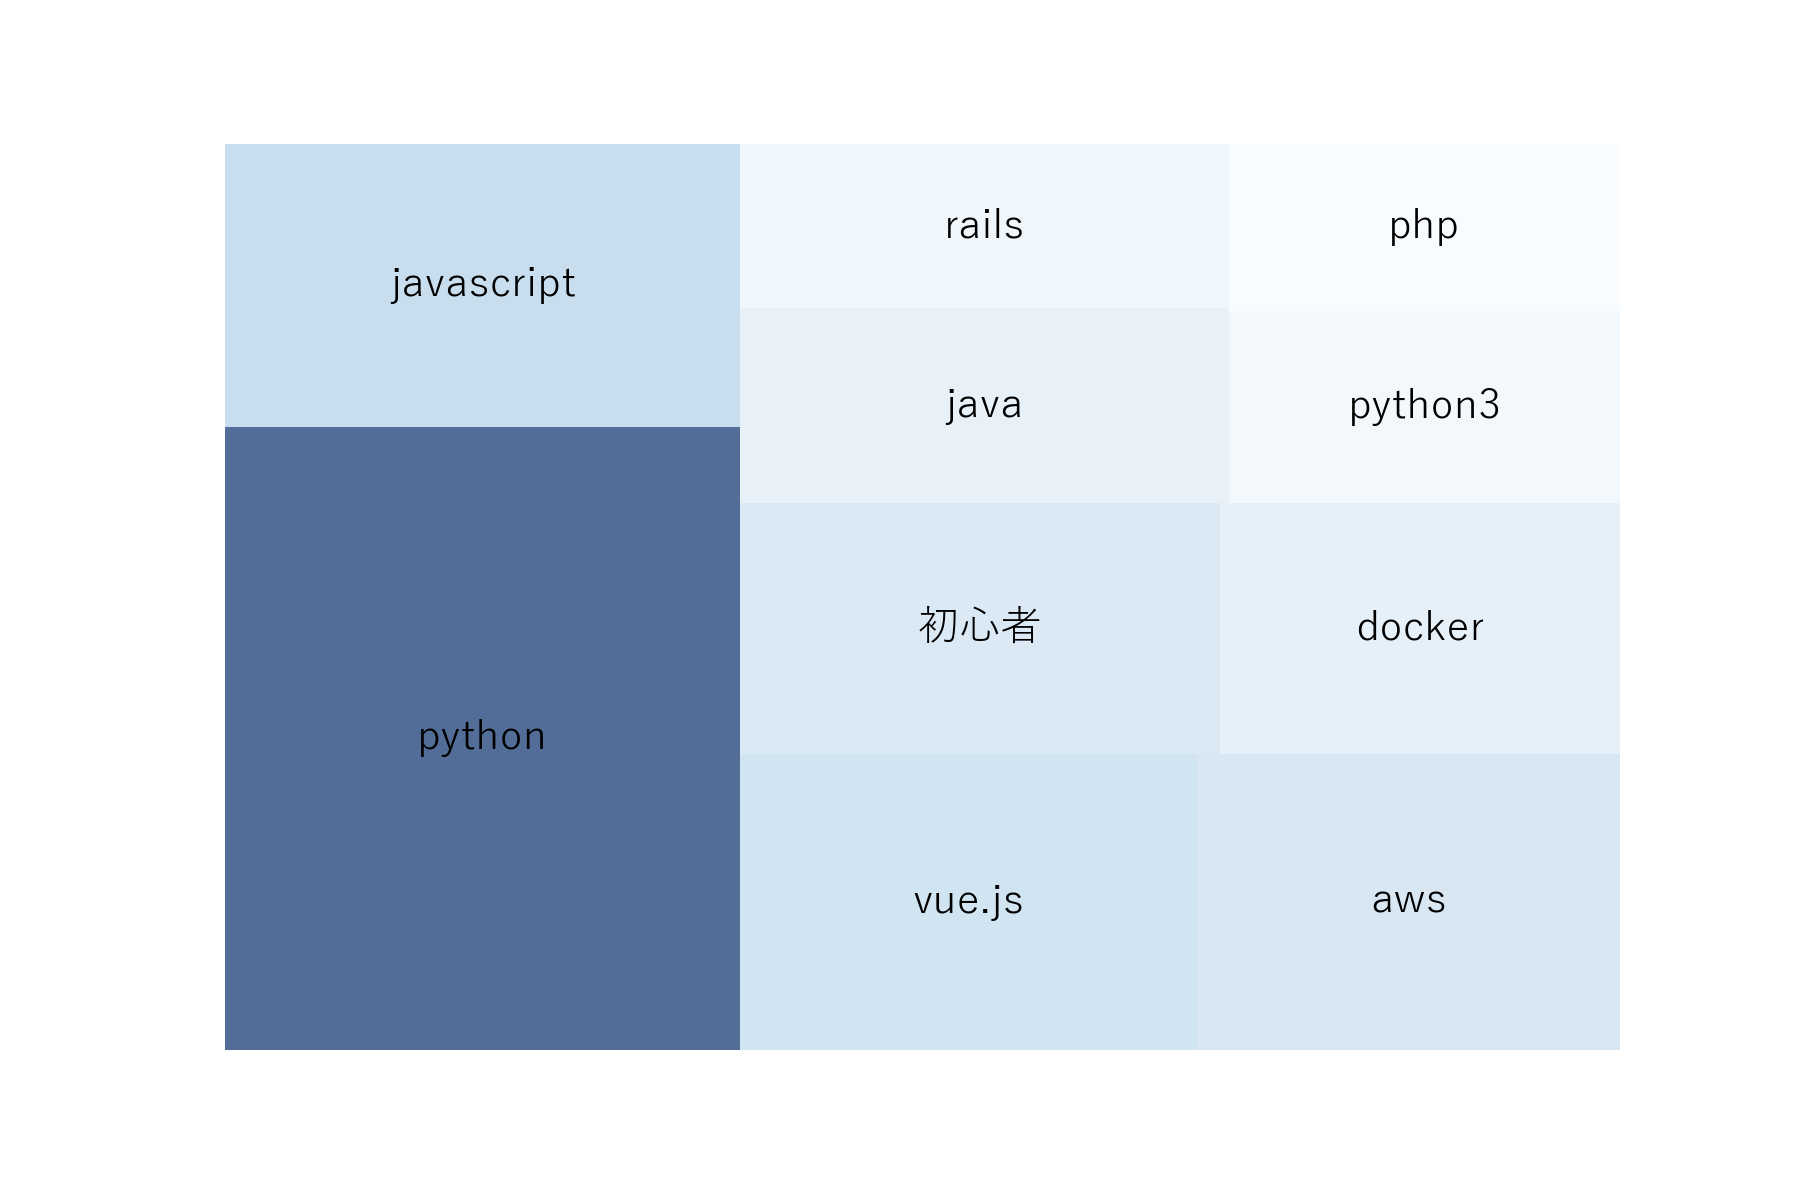
次に、#202 Treemap with colors mapped on valuesのサンプルコードを参考に青系のグラデーションで描画。
from pathlib import Path
import matplotlib
import matplotlib.pyplot as plt
import squarify

cmap = matplotlib.cm.Blues
mini = min(tagCount)
maxi = max(tagCount)
norm = matplotlib.colors.Normalize(vmin=mini, vmax=maxi)
colors = [cmap(norm(value)) for value in tagCount]

result_dir_path = Path('..').joinpath('result')
plt.rcParams["font.family"] = 'Yu Gothic'
squarify.plot(sizes=list(tagCount), label=list(tagSurface), alpha=0.7, color=colors)
plt.axis('off')
plt.savefig(result_dir_path.joinpath('trends_of_qiita_treemap2.png'), format="png", dpi=300)
plt.show()
やはりPythonとJavaScriptが大きく描画されるのは前回(Qiita記事のタグからWordCloudを描画してみた)と変わらず。
まとめ
Qiita記事のタグを使って、Treemapを描画する方法を紹介。