こんにちは![]()
Perl 6 Advent Calendar 2016の8日目です。
今日はPerl6でグラフを描いてみようと思います。
Perl6 でグラフを描くのに用いるモジュール
Perl6 でグラフを描画するときは SVG::Plot を使います。
$ p6doc SVG::Plot
p6doc や、あとexamplesディレクトリ以下のファイルを見ればなんとなく使い方がわかります(ざっくり)
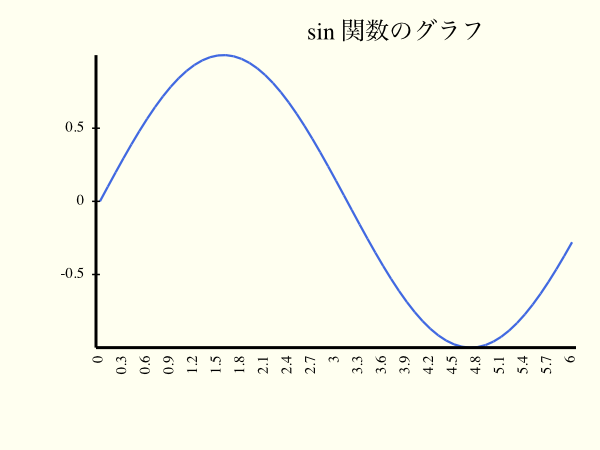
sin 関数のグラフ
use v6;
use SVG;
use SVG::Plot;

# 0 から 6 まで 0.1 刻みで生成
my @x = 0.0, 0.1 ... 6.0 ;

# それぞれ sin(x) を計算
my @y = @x».sin ;

# グラフの描画
my $fh = open 'sin.svg', :w ;
$fh.say(
  SVG.serialize: SVG::Plot.new(
      :title( 'sin 関数のグラフ' ),
      :width( 400 ),
      :height( 300 ),
      :background( '#fffff0' ),
      :colors( '#4169e1' ),
      :label-font-size(10),
      :labels( @x ),
      :values( $@y ),
  ).plot(:lines)
) ;
$fh.close ;
このスクリプトを実行すると、以下のようなファイルが出力されます。
余談ですが、Python で numpy.arange(0, 6, 0.1) と書くと、生成されるのは [0.0, 0.1, ..., 5.9] であり、 6.0 は含まれません。
Perl6 で同じような値を得るためには 0.0, 0.1 ...^ 6.0 と書きます。
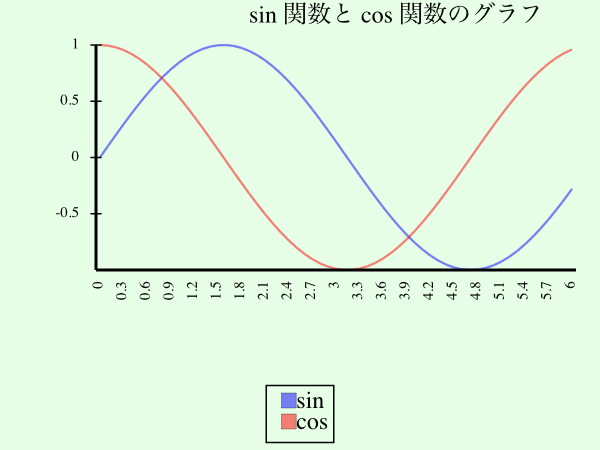
cos 関数のグラフも追加
use v6;
use SVG;
use SVG::Plot;

# 0 から 6 まで 0.1 刻みで生成
my @x = 0.0, 0.1 ... 6.0 ;

# それぞれ sin(x) を計算
my @y1 = @x.map:{ .sin } ;

# それぞれ cos(x) を計算
my @y2 = map *.cos, @x ;

# グラフの描画
my $fh = open 'sin_cos.svg', :w ;
$fh.say(
  SVG.serialize: SVG::Plot.new(
      title => 'sin 関数と cos 関数のグラフ' ,
      width => 400 ,
      height => 300 ,
      background => 'rgba(0,255,0,0.1)' ,
      colors => ( 'rgba(0,0,255,0.5)', 'rgba(255,0,0,0.5)' ) ,
      label-font-size => 10 ,
      labels => ( @x ) ,
      values => ( [@y1], [@y2] ) ,
      legend-font-size => 10 ,
      legends => ( 'sin', 'cos' ) ,
  ).plot(:lines)
) ;
$fh.close ;
ところどころ書き方を変えてみてます。
ステップ関数とシグモイド関数
use v6;
use SVG;
use SVG::Plot;

sub step_function(Rat $i){
  return ($i > 0).Int ;
}

sub sigmoid(Rat $i){
  return 1 / ( 1 + exp(-$i) ) ;
}

my @x = -5.0, -4.9 ... 5.0 ;
my @y1 = @x».&step_function ;
my @y2 = @x».&sigmoid ;

# グラフの描画
my $fh = open 'step_sigmoid.svg', :w ;
$fh.say(
   SVG.serialize: SVG::Plot.new(
      title => 'ステップ関数とシグモイド関数' ,
      width => 400 ,
      height => 300 ,
      min-y-axis => -0.1,
      background => 'ghostwhite' ,
      colors => ( 'mediumseagreen', 'orangered' ) ,
      label-font-size => 10 ,
      labels => ( @x ) ,
      values => ( [@y1], [@y2] ) ,
      legend-font-size => 10 ,
      legends => ( 'Step function', 'Sigmoid function' ) ,
  ).plot(:lines)
) ;
$fh.close ;
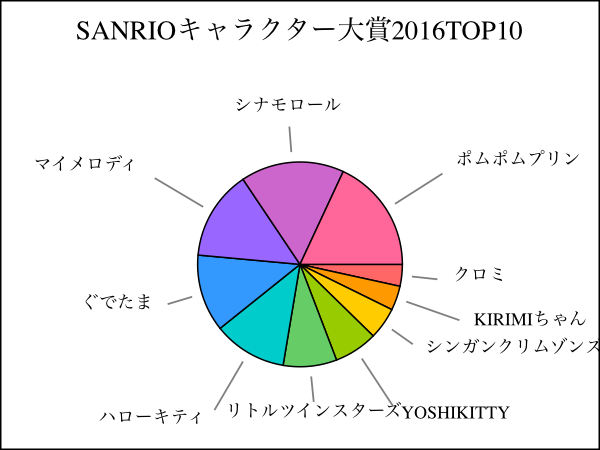
得票率円グラフ
英語で言うとパイチャート
use v6;
use SVG;
use SVG::Plot::Pie;

my %counts =
    ポムポムプリン => 807_389,
    シナモロール => 730_207,
    マイメロディ => 632_662,
    ぐでたま => 545_268,
    ハローキティ => 519_113,
    リトルツインスターズ => 377_873,
    YOSHIKITTY => 307_105,
    シンガンクリムゾンズ => 225_169,
    KIRIMIちゃん => 171_846,
    クロミ => 153_806,
    ;

my @colors = (
    '#ff6666',
    '#ff9900',
    '#ffcc00',
    '#99cc00',
    '#66cc66',
    '#00cccc',
    '#3399ff',
    '#9966ff',
    '#cc66cc',
    '#ff6699',
) ;

my @c = %counts.sort: *.value ;
my @values = @c».value ;
my @labels = @c».key ;

my $svg = SVG::Plot::Pie.new(
    width   => 400,
    height  => 300,
    values  => [$(@values)],
    labels  => @labels,
    colors => @colors ,
    title   => 'SANRIOキャラクター大賞2016TOP10',
).plot(:pie) ;

my $fh = open 'sanrio.svg', :w ;
$fh.say( SVG.serialize($svg) ) ;
$fh.close ;
YOSHIKITTY の存在感がヤヴァい。
おわり
グラフ化されると値がわかりやすくていいですね。1
ここまでおつきあいいただきありがとうございました![]()
明日は @titsuki さんです![]()
よろしくおねがいします![]()
参考と注釈
-
見た目ちょっと無骨ではありますが ↩


