この記事でできること
- OpenRouter APIから全モデルの価格データを取得する方法がわかる
- D3.jsで対数スケールのバブルチャートを実装できる
- 価格の前日比(ダンベルチャート)を可視化できる
- WordPress環境でD3.jsを動かすときのつまずきポイントがわかる
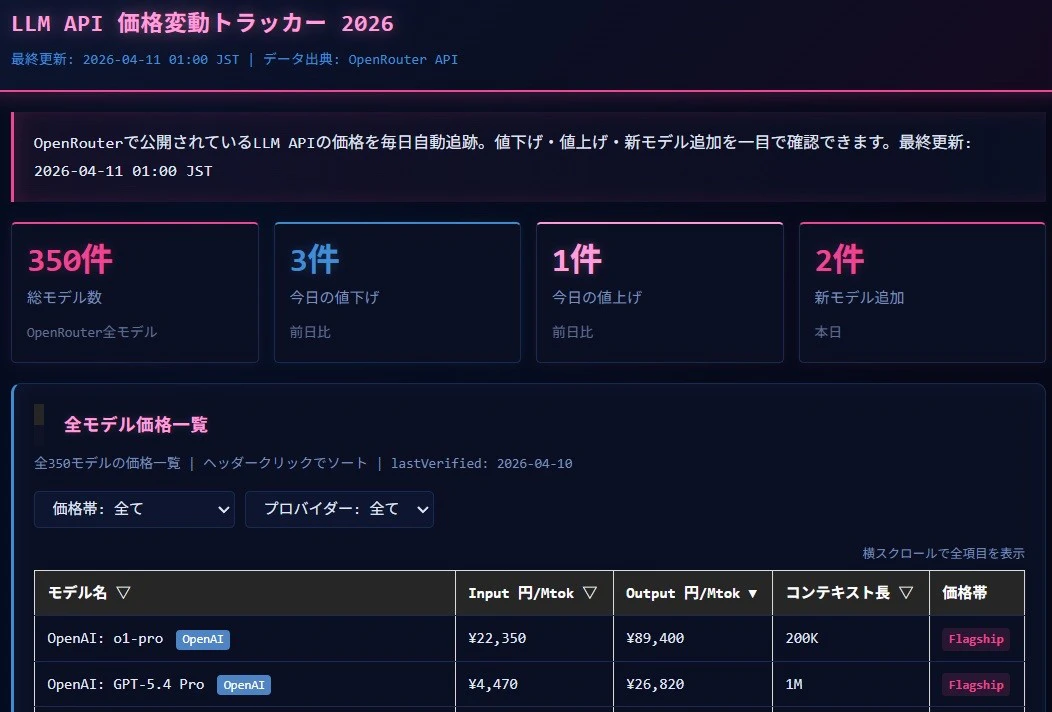
- 動作するツールはLLM API 価格変動トラッカー 2026で確認できる
環境・前提
- ブラウザ: Chrome / Firefox / Safari(モバイル含む)
- D3.js: v7(CDNから動的ロード)
- CMS: WordPress(SWELLテーマ)
- データ配信: GitHub Actions → GitHub Pages(JSON)
- 言語: Vanilla JS(フレームワークなし)
完成形
- KPIカード: 今日の値下げ/値上げ/新モデル件数を表示
- バブルチャート: Input価格×Output価格×コンテキスト長を3変数で可視化
- ダンベルチャート: 前日比の価格変動をビジュアル化
- 折れ線グラフ: 主要10モデルの価格推移(7/14/30日)
手順
Step 1: OpenRouter APIでモデルデータを取得する
まずAPIの構造を確認する。
GET https://openrouter.ai/api/v1/models
レスポンスのキー構造(主要フィールド):
{
  "data": [
    {
      "id": "openai/gpt-4o",
      "name": "GPT-4o",
      "context_length": 128000,
      "pricing": {
        "prompt": "0.0000025",   // $/token(1トークンあたり)
        "completion": "0.00001"  // $/token(1トークンあたり)
      }
    }
  ]
}
注意点: pricing.prompt は「1トークンあたりのUSD」。$/Mトークン(100万トークンあたり)に換算するには1,000,000倍する。
const inputPrice = parseFloat(model.pricing.prompt) * 1000000; // $/Mトークンに換算
const outputPrice = parseFloat(model.pricing.completion) * 1000000;
つまずきポイント: pricing の値は文字列として返ってくる。parseFloat() を忘れると計算が狂う。
Step 2: GitHub Actionsで毎日自動フェッチ
手動でAPIを叩くのは現実的でない。GitHub ActionsのCronで毎日16:00 JSTに自動実行する。
# .github/workflows/fetch_prices.yml
name: Fetch OpenRouter Prices

on:
  schedule:
    - cron: '0 7 * * *'  # 毎日07:00 UTC = 16:00 JST
  workflow_dispatch:  # 手動実行も可

jobs:
  fetch:
    runs-on: ubuntu-latest
    steps:
      - uses: actions/checkout@v4

      - name: Fetch OpenRouter API
        run: |
          curl -s https://openrouter.ai/api/v1/models \
            -H "Authorization: Bearer ${{ secrets.OPENROUTER_API_KEY }}" \
            > data/raw_$(date +%Y-%m-%d).json

      - name: Generate summary.json
        run: python scripts/generate_summary.py

      - name: Deploy to GitHub Pages
        uses: peaceiris/actions-gh-pages@v3
        with:
          github_token: ${{ secrets.GITHUB_TOKEN }}
          publish_dir: ./data
generate_summary.py の中で前日のJSONと今日のJSONを比較して priceChangePercent を計算する。
つまずきポイント: Actions のシークレット設定を忘れやすい。リポジトリの Settings → Secrets and variables → Actions で OPENROUTER_API_KEY を設定する。
Step 3: D3.jsのロード(WordPressの罠)
WordPressのSWELLテーマは <script src="..."> を含む外部スクリプトタグを無視する。
<!-- NGパターン: SWELLが黙って無視する -->
<script src="https://cdn.jsdelivr.net/npm/d3@7"></script>
// OKパターン: 動的ロード
function loadD3(callback) {
  if (typeof d3 !== 'undefined') {
    callback();
    return;
  }
  var s = document.createElement('script');
  s.src = 'https://cdn.jsdelivr.net/npm/d3@7';
  s.onload = callback;
  document.head.appendChild(s);
}

loadD3(function() {
  initAllCharts();
});
つまずきポイント: コンソールにエラーが出ない。チャートが白紙になるだけ。WordPressで初めてD3を使う場合、ここで時間を消費する。
Step 4: 対数スケールのバブルチャートを実装する
LLM(大規模言語モデル)のAPI価格帯は極端に広い。
| モデルカテゴリ | Input価格の目安 |
|---|---|
| Free | $0 |
| Budget | $0.01〜$1 |
| Mid | $1〜$10 |
| Flagship | $10〜$60+ |
$0.01と$60を線形スケールで表示すると安いモデルが全部原点に張り付いて見えなくなる。対数スケールが必須。
function drawBubbleChart(models) {
  const wrapper = document.getElementById('aji-opt-bubble-chart');
  const width = wrapper.clientWidth;
  const isMobile = width < 768;

  const margin = isMobile
    ? { top: 20, right: 10, bottom: 40, left: 10 }
    : { top: 20, right: 20, bottom: 50, left: 60 };

  const innerW = width - margin.left - margin.right;
  const innerH = isMobile ? 250 : 400;

  const svg = d3.select(wrapper).append('svg')
    .attr('width', width)
    .attr('height', innerH + margin.top + margin.bottom)
    .append('g')
    .attr('transform', `translate(${margin.left},${margin.top})`);

  // 対数スケール(Freeモデル=$0 は除外済みを前提)
  const xScale = d3.scaleLog()
    .domain([0.01, d3.max(models, d => d.inputPrice) * 1.2])
    .range([0, innerW]);

  const yScale = d3.scaleLog()
    .domain([0.01, d3.max(models, d => d.outputPrice) * 1.2])
    .range([innerH, 0]);

  // バブルサイズはsqrtスケール(コンテキスト長)
  const rScale = d3.scaleSqrt()
    .domain([0, d3.max(models, d => d.contextLength)])
    .range([6, 40]); // 最小6px = スマホタップ可能サイズ

  // バブルを描画
  svg.selectAll('.bubble')
    .data(models).enter()
    .append('circle')
    .attr('class', 'bubble')
    .attr('cx', d => xScale(d.inputPrice))
    .attr('cy', d => yScale(d.outputPrice))
    .attr('r', d => rScale(d.contextLength))
    .attr('fill', d => PROVIDER_COLORS[d.provider] || '#6c6f85')
    .attr('fill-opacity', 0.7)
    .attr('stroke', '#2a2a4a')
    .attr('stroke-width', 1);
}
つまずきポイント: d3.scaleLog() のdomain下限に0を入れるとエラーになる。必ず正の値(例: 0.01)を指定する。
Step 5: Freeモデルを別処理にする
対数スケールのため$0のモデルはチャートに入れられない。
// Freeモデルを分離
const chartModels = allModels.filter(d => d.inputPrice > 0);
const freeCount = allModels.filter(d => d.inputPrice === 0).length;

// チャートはFree除外で描画
drawBubbleChart(chartModels);

// 件数は凡例下にテキストで表示
const freeNote = document.createElement('div');
freeNote.className = 'aji-opt-free-count';
freeNote.textContent = `Free: ${freeCount}件(チャート外・価格$0のため対数スケール非対応)`;
wrapper.appendChild(freeNote);
Step 6: && を使わない(WordPressの罠その2)
WordPress/SWELLは && を && に変換してJSを壊す。
// NGパターン(WordPressが破壊する)
if (data !== null && data.models.length > 0) {
  renderBubble(data.models);
}

// OKパターン(ネストif)
if (data !== null) {
  if (data.models.length > 0) {
    renderBubble(data.models);
  }
}
つまずきポイント: コンソールのエラーメッセージが && に化けているので原因に気づきにくい。最初から && を使わない習慣にするのが楽。
Step 7: スマホ用の下部固定パネルを実装する
スマホではバブルをタップしたときの詳細表示を画面下部に固定パネルで出す。ホバー型ツールチップはスマホで画面外にはみ出して読めない。
// パネルのHTML(ラッパー直下に配置。ラッパー外に出さない)
const panelHTML = `
  <div id="aji-opt-panel" style="
    display: none;
    position: fixed;
    bottom: 0;
    left: 0;
    width: 100%;
    background: #1a1a2e;
    border-top: 2px solid var(--aji-accent);
    max-height: 40vh;
    overflow-y: auto;
    z-index: 10000;
    padding: 12px;
    box-sizing: border-box;
  ">
    <button id="aji-opt-panel-close" style="float:right;">×</button>
    <div id="aji-opt-panel-content"></div>
  </div>
`;

wrapper.insertAdjacentHTML('beforeend', panelHTML);

// 閉じるボタン
document.getElementById('aji-opt-panel-close')
  .addEventListener('touchend', function() {
    document.getElementById('aji-opt-panel').style.display = 'none';
  });

// バブルのタッチ
bubble.addEventListener('touchstart', function(e) {
  e.stopPropagation();
  if (window.innerWidth < 768) {
    const content = `
      <strong>${d.name}</strong>
      <div>Input: $${d.inputPrice} / Mトークン</div>
      <div>Output: $${d.outputPrice} / Mトークン</div>
      <div>Context: ${(d.contextLength / 1000).toFixed(0)}K トークン</div>
    `;
    document.getElementById('aji-opt-panel-content').innerHTML = content;
    document.getElementById('aji-opt-panel').style.display = 'block';
  }
}, { passive: false });
つまずきポイントまとめ
-
pricing.promptは文字列:parseFloat()を忘れると全価格が0になる -
対数スケールに0は入れられない:
scaleLog()のdomain下限は必ず正の値 - Freeモデルは別処理: $0のモデルはチャートから除外してテキストで件数表示
-
<script src>が効かない: SWELLが黙って無視する。createElement('script')で動的ロード -
&&が壊れる: WordPressが&&に変換する。ネストifに置き換える -
スマホツールチップはみ出し: 下部固定パネル方式に統一する(
position: fixed; bottom: 0) - データ蓄積前の折れ線: 初日はデータが1点しかないので「データ蓄積中(X日分)」と表示する
まとめ
- OpenRouter APIは
pricing.promptを文字列で返す。パースと単位換算を忘れない - 価格帯が100倍以上開く場合は対数スケール一択
- Freeモデル($0)は対数スケールで表示不可。件数のみテキスト表示
- WordPress+SWELLの罠(
<script src>無視・&&変換)は最初から避ける書き方に慣れる - スマホのタッチUXはホバー型ではなく下部固定パネル型が安定
ツールはここで動いている。
LLM API 価格変動トラッカー 2026
出典
- OpenRouter「Models API」2026年4月(
openrouter.ai/api/v1/models、lastVerified: 2026-04-10) - D3.js v7: https://d3js.org/
- GitHub Actions公式ドキュメント: https://docs.github.com/en/actions