0
1

Delete article

Deleted articles cannot be recovered.

Draft of this article would be also deleted.

Are you sure you want to delete this article?

More than 5 years have passed since last update.

R > 列データを行データに変換する > newy<-as.data.frame(t(y))

Last updated at Posted at 2016-09-19
動作環境
RStudio 0.99.903 on Windows 7 pro
R version 3.3.1

http://qiita.com/7of9/items/b2add25c1d95043b14f5
にて取得した列データをグラフ化したい。

そのためには列データを行データに変換すれば良さそう。

その変換にはas.data.frame()とt()を組合せるようだ。
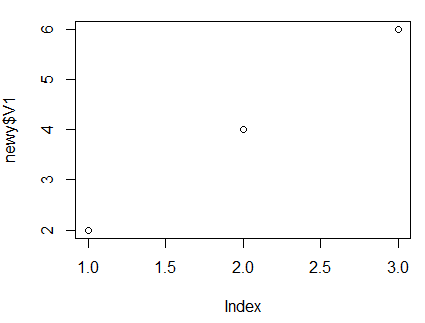
参考 stackoverflow

> x[c(seq(2,6,2))]
  V2 V4 V6
1  2  4  6
> y<-x[c(seq(2,6,2))]
> newy<-as.data.frame(t(y))
> newy
   V1
V2  2
V4  4
V6  6

> plot(newy$V1)

qiita.png

0
1
0

Register as a new user and use Qiita more conveniently

  1. You get articles that match your needs
  2. You can efficiently read back useful information
  3. You can use dark theme
What you can do with signing up
0
1

Delete article

Deleted articles cannot be recovered.

Draft of this article would be also deleted.

Are you sure you want to delete this article?