動作環境
GeForce GTX 1070 (8GB)
ASRock Z170M Pro4S [Intel Z170chipset]
Ubuntu 16.04 LTS desktop amd64
TensorFlow v1.2.1
cuDNN v5.1 for Linux
CUDA v8.0
Python 3.5.2
IPython 6.0.0 -- An enhanced Interactive Python.
gcc (Ubuntu 5.4.0-6ubuntu1~16.04.4) 5.4.0 20160609
GNU bash, version 4.3.48(1)-release (x86_64-pc-linux-gnu)
scipy v0.19.1
geopandas v0.3.0
MATLAB R2017b (Home Edition)
pySpherepts > sphereptsのNumpy、Scipy実装 > 結果: sphereptsと同じものが得られた
にてNumpy+Scipyでの処理結果をJupyterで表示したい。
参考
データ例
読込むデータはpySphereptsで生成した座標データ。
$ head res_trisectTri_171126.txt
[[-0.98302355 -0.18347941  0.        ]
 [-0.98302355  0.18347941  0.        ]
 [-0.93417236  0.         -0.35682209]
 [-0.93417236  0.          0.35682209]
 [-0.85198102 -0.39551069 -0.34307382]
 [-0.85198102 -0.39551069  0.34307382]
 [-0.85198102  0.39551069 -0.34307382]
 [-0.85198102  0.39551069  0.34307382]
 [-0.85065081 -0.52573111  0.        ]
 [-0.85065081  0.52573111  0.        ]
code
上記のリンク先コードから以下などを変更した。
- 点の位置をradial direction外側に移動
- 下地の球の色を変更
- figsize変更
plotSphNodes_171126.ipynb
import matplotlib.pyplot as plt
from matplotlib import cm, colors
from mpl_toolkits.mplot3d import Axes3D
import numpy as np
from pylab import rcParams

# https://stackoverflow.com/questions/31768031/plotting-points-on-the-surface-of-a-sphere-in-pythons-matplotlib

rcParams['figure.figsize'] = 10,10

# Create a sphere
r = 1
pi = np.pi
cos = np.cos
sin = np.sin
phi, theta = np.mgrid[0.0:pi:100j, 0.0:2.0*pi:100j]
x = r*sin(phi)*cos(theta)
y = r*sin(phi)*sin(theta)
z = r*cos(phi)

# Import data
data = np.genfromtxt('res_IcodsNodes_4_0_171126.txt')
data = data * 1.0005
xx, yy, zz = np.hsplit(data, 3)


# Set colours and render
fig = plt.figure()
ax = fig.add_subplot(111, projection='3d')

ax.plot_surface(
    x, y, z,  rstride=1, cstride=1, color='y', alpha=1.0, linewidth=0)

ax.scatter(xx,yy,zz,color="k",s=15)

ax.set_xlim([-1,1])
ax.set_ylim([-1,1])
ax.set_zlim([-1,1])
ax.set_aspect("equal")
plt.tight_layout()
plt.show()
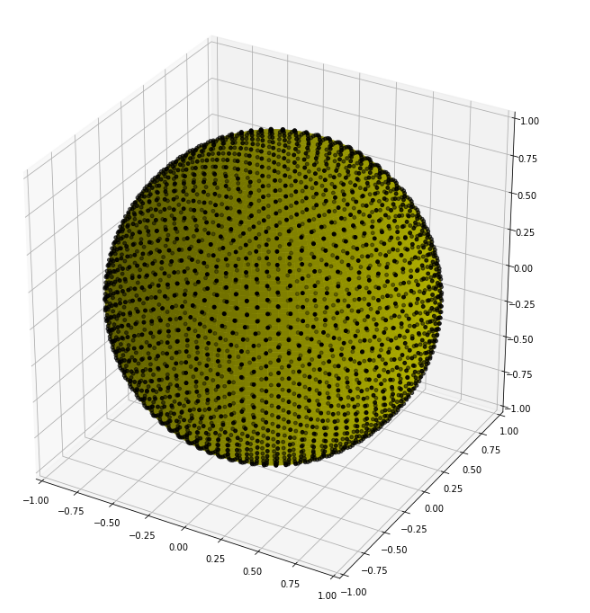
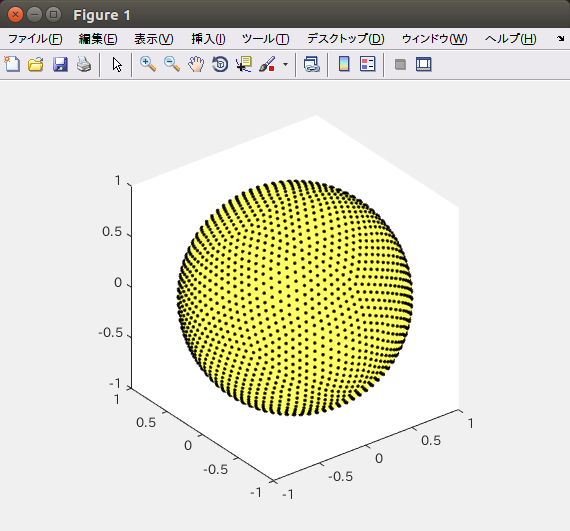
下の図(MATLAB上でsphereptsのplotSphNodes使用)と比べて見栄えが良くない。分布の感じがつかみにくい。
本来見えない奥側の点も見えているようだ。
点の影が映っているのかもしれない。
中央の球を消した時と消さない場合で同じ点が見えているため、奥側の点が見えているのかもしれない。