動作環境
GeForce GTX 1070 (8GB)
ASRock Z170M Pro4S [Intel Z170chipset]
Ubuntu 16.04 LTS desktop amd64
TensorFlow v1.2.1
cuDNN v5.1 for Linux
CUDA v8.0
Python 3.5.2
IPython 6.0.0 -- An enhanced Interactive Python.
gcc (Ubuntu 5.4.0-6ubuntu1~16.04.4) 5.4.0 20160609
GNU bash, version 4.3.48(1)-release (x86_64-pc-linux-gnu)
scipy v0.19.1
geopandas v0.3.0
MATLAB R2017b (Home Edition)
関連
pySpherepts
上記のMATLABコードの一部であるgetIcosNodes.mをNumpy+Scipy実装した。
名称は「pySpherepts」とする。
コードは中身を整理した上でGitHubに上げる予定。
pySpherepts結果
使ってみた。
test_getIcosNode_171126.py
import numpy as np
import getIcosNodes_171126 as gIN

xs, tris = gIN.getIcosNodes(4,0)
print(xs)
np.savetxt('res_IcodsNodes_4_0_171126.txt', xs, fmt="%.5f")
上記の結果をMATLAB上で読込み、オリジナルのsphereptsの表示プログラムplotSphNodesで表示してみた。
test_numpyIcosNodes_171126.m
function test_numpyIcosNodes_171126()
    xs = load('res_IcodsNodes_4_0_171126.txt')
    plotSphNodes(xs)
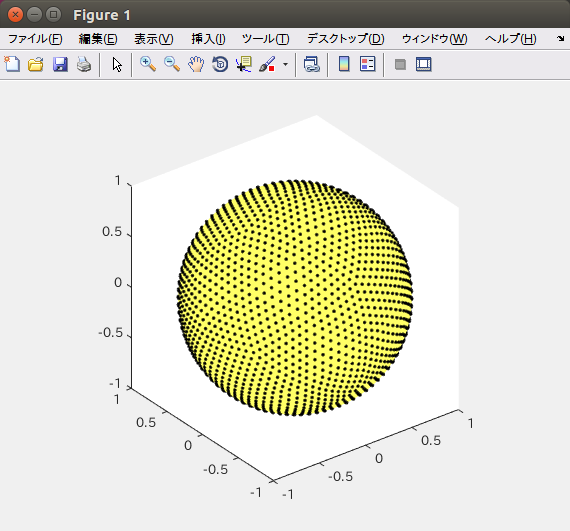
spherepts結果
オリジナルのsphereptsの結果
>> [x0,tri0] = getIcosNodes(4,0);
>> plotSphNodes(x0)

同じものが得られた。
MATLAB分からなかったので、勉強しながら20時間はかかっただろうか。