動作環境
GeForce GTX 1070 (8GB)
ASRock Z170M Pro4S [Intel Z170chipset]
Ubuntu 16.04 LTS desktop amd64
TensorFlow v1.2.1
cuDNN v5.1 for Linux
CUDA v8.0
Python 3.5.2
IPython 6.0.0 -- An enhanced Interactive Python.
gcc (Ubuntu 5.4.0-6ubuntu1~16.04.4) 5.4.0 20160609
GNU bash, version 4.3.48(1)-release (x86_64-pc-linux-gnu)
scipy v0.19.1
geopandas v0.3.0
MATLAB R2017b (Home Edition)
ADDA v.1.3b6
gnustep-gui-runtime v0.24.0-3.1
Jaybird RUN (ワイヤレスイヤホン)
動作環境2
ESP8266
MPU-9250
パンチングレザー実装
プロジェクト開始: https://qiita.com/7of9/items/4077c92b9a773e054193
MemoryEnhancer > MEGLV > udpGraph_180218.ipynb > v0.1, v0.2 > ESP8266+MPU-9250測定データの確認用リアルタイムグラフ出力
の続き。
処理概要
- ESP8266 + MPU-9250による測定データがUDP通信で7000ポートに入ってくる
-
MemoryEnhancer > MEUI > ESP8266_180121.ino > v0.1-v0.4 > MPU-9250からQuaternionを取得し、UDP送信する > 回路 + コード + 動作確認
- 上記の実装機版をこちらに記載のようにパンチングレザーに実装済
-
MemoryEnhancer > MEUI > ESP8266_180121.ino > v0.1-v0.4 > MPU-9250からQuaternionを取得し、UDP送信する > 回路 + コード + 動作確認
- データ例
qtn,-0.04,0.04,-0.60<CR><LF>
- そのデータを元にコマンド処理をするため、リアルタイムグラフ出力する
- 描画はeog(Eye of GNOME)が担当
code v0.3
- 測定データをログファイルに保存する機能追加
コマンド識別に使う
udpGraph_180218.ipynb
import numpy as np
import matplotlib.pyplot as plt
import time
import sys
import socket as skt
from datetime import datetime as dt

'''
v0.3 Mar. 04, 2018
    - udpReceiver() saves to log file
        + add saveToLogFile()
        + add [LOG_FILENAME]
v0.2 Feb. 18, 2018
    - refactor
        + add drawGraph()
v0.1 Feb. 18, 2018
    - save to png
    - add udpReceiver()
'''

# on Python 3.5.2

RECV_TIMEOUT_MSEC = 300
MAX_DATA = 50
TRIM_DATA = 5
NUM_SERIES = 3
LOG_FILENAME = 'log.udpGraph_180218'


def drawGraph(ax1, data, xs, yss):
        # 1. trim old data
        if len(xs) > MAX_DATA:
            del xs[0:TRIM_DATA]
            for idx in range(NUM_SERIES):
                del yss[idx][0:TRIM_DATA]
        # 2. add data
        xs += [time.time()]
        for idx in range(NUM_SERIES):
            yss[idx] += [data[idx]]
            graphs[idx].set_data(xs, yss[idx])
        if min(xs) == max(xs):
            return
        ax1.set_xlim(min(xs), max(xs))
        # for realtime display on the eog(Eye of GNOME)
        fig.savefig("graph.png")


def saveToLogFile(data):
    strnow = dt.now().strftime('%Y/%m/%d %H:%M:%S')
    wrk = strnow, *data
    with open(LOG_FILENAME, 'ab') as f_hndl:
        wrk = [wrk]  # to avoid LF elementwise for 1-D array
        np.savetxt(f_hndl, wrk, fmt='%s', delimiter=' ')


def udpReceiver(port_in, xs, yss):
    inst = skt.socket(skt.AF_INET, skt.SOCK_DGRAM)
    inst.bind(('', port_in))
    inst.setblocking(0)
    while True:
        try:
            data, adr = inst.recvfrom(RECV_TIMEOUT_MSEC)
        except skt.error:
            pass
        else:
            data = data.decode("utf-8")
            data = data.replace("\r\n", "")
            # ['qtn', '-0.04', '0.04', '-0.60']
            data = data.split(",")
            drawGraph(ax1, data[1:], xs, yss)
            saveToLogFile(data[1:])


fig = plt.figure()
ax1 = fig.add_subplot(1, 1, 1)
ax1.set_ylim(-1.0, 1.0)
xs, yss, graphs = [], [], []
for idx in range(NUM_SERIES):
    yss += [[]]
    graphs += [ax1.plot(xs, yss[idx])[0]]

udpReceiver(7000, xs, yss)
データ測定手順
- graph.pngをeog(Eye of GNOME)で表示しておく
- リアルタイム描画用
- MEGLV(グローブinterface)を装着し、電池を接続
- 1のウィンドウをpeekで録画開始
- udpGraph_180218.ipynbをJupyterにて実行
- order_gesture_180225.py (v0.2)を実行
- 音声指示に従い、コマンド用の動作を行う
- Finishedという音声を聞いた時点で終了する
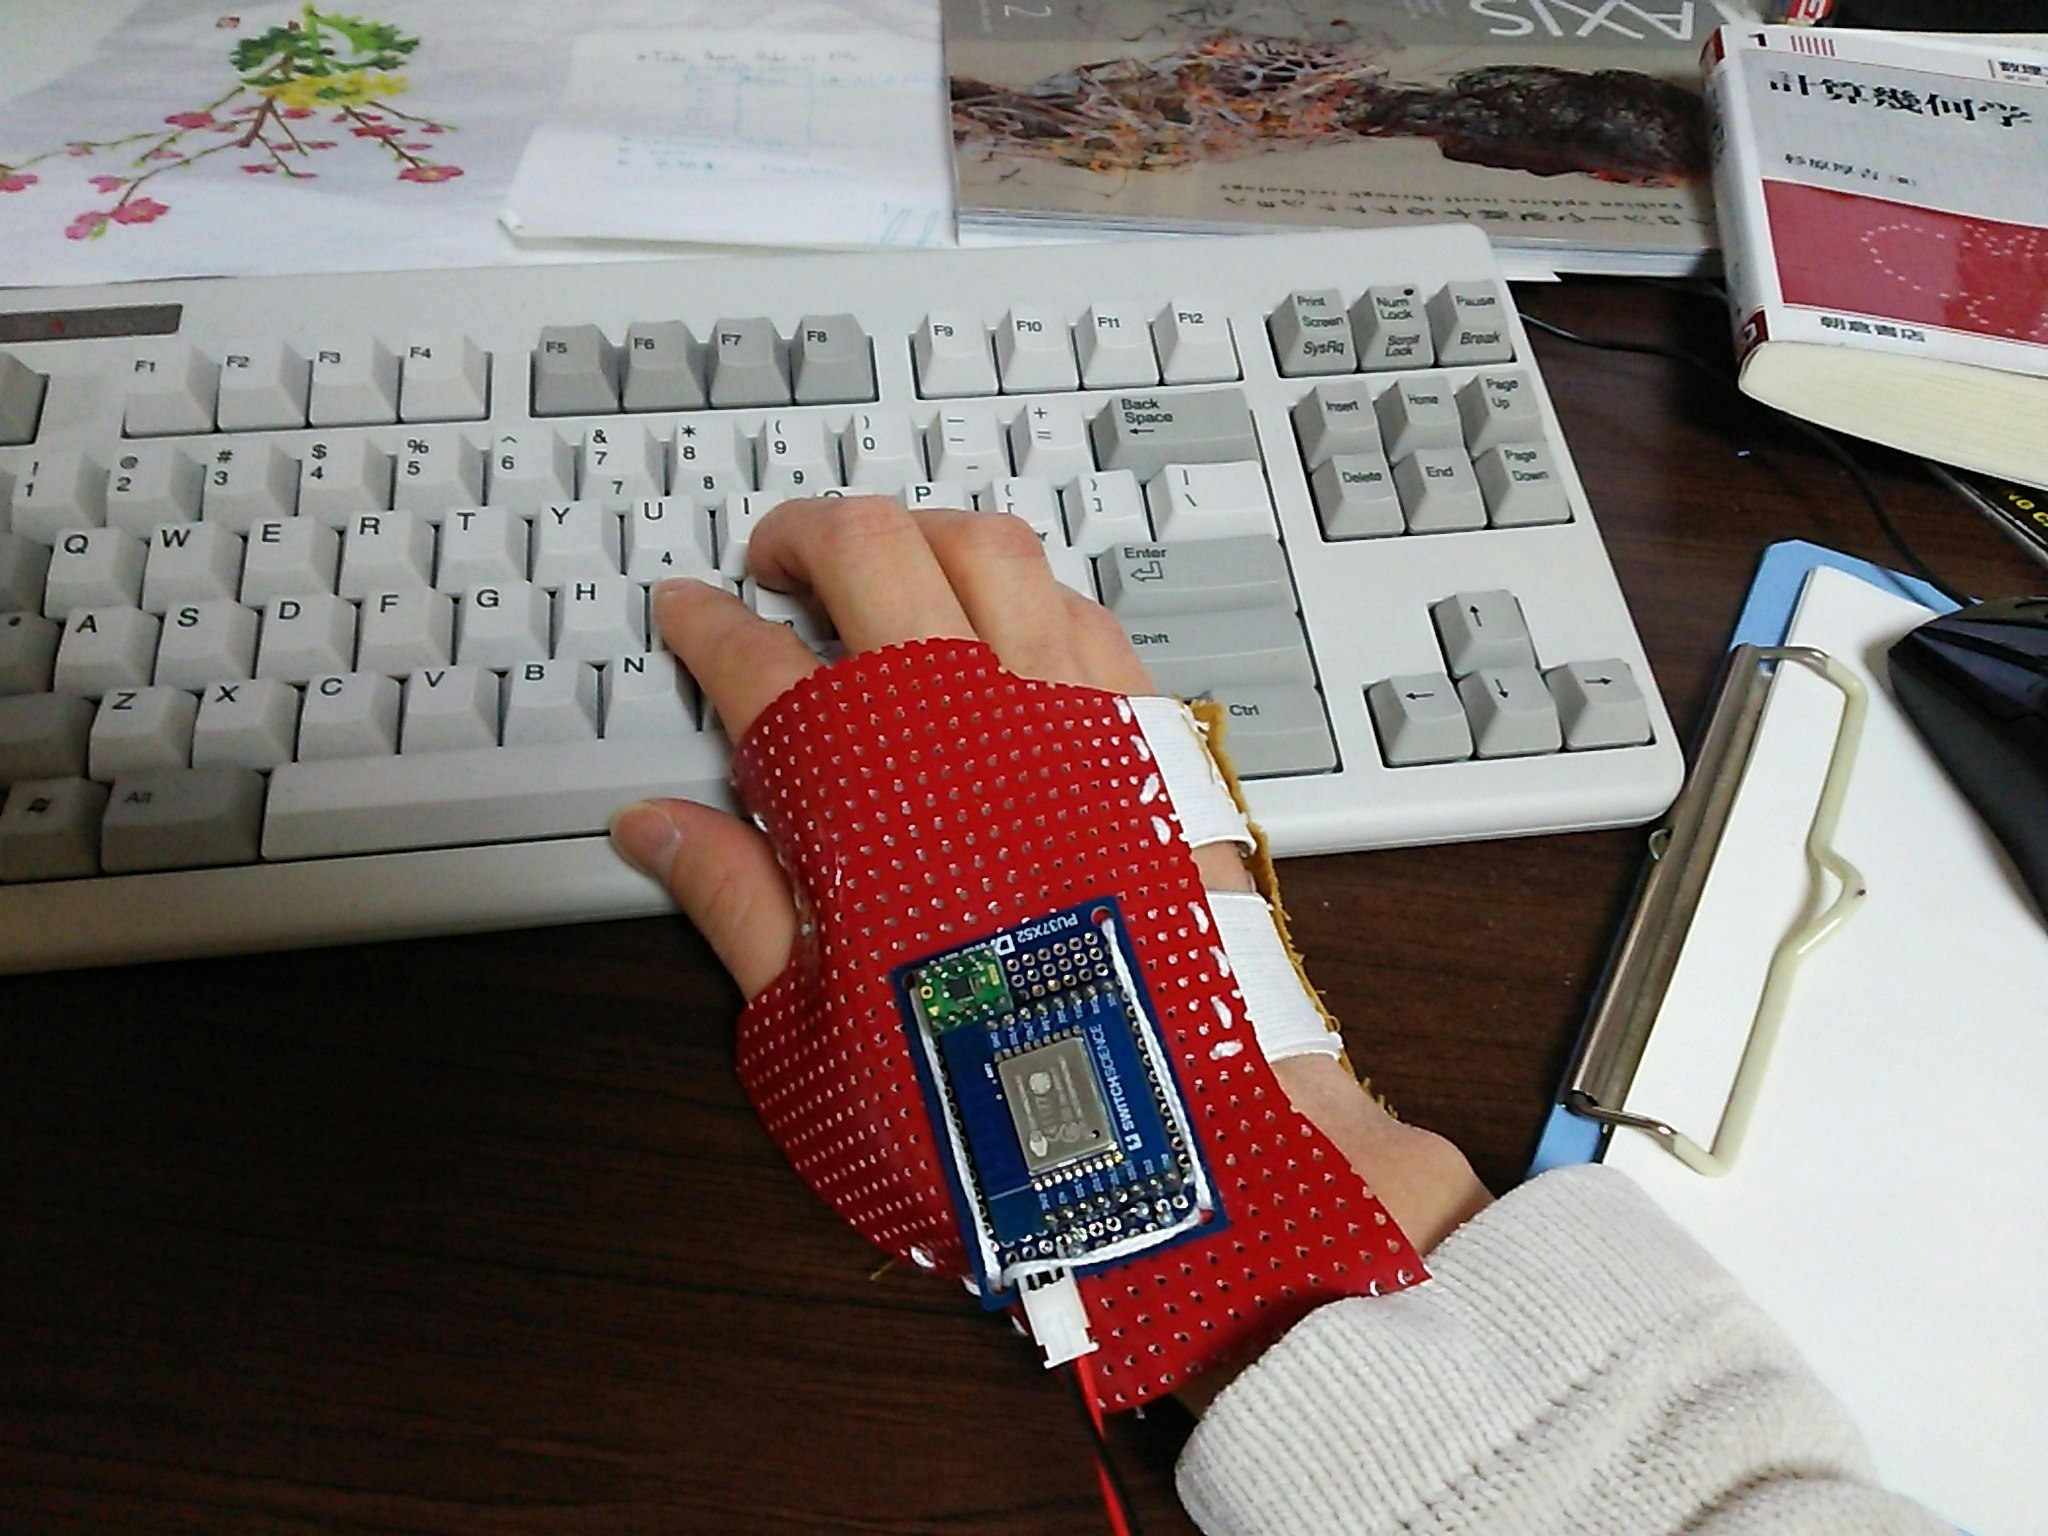
Fig.1 MEGLV(グローブinterface)
取得データ例
-
Home position
-
Command
- Roll: 伸ばした腕を右回転する
-
測定データ
log.udpGraph_180218
2018/03/04 09:27:34 -0.09 0.03 -0.55
2018/03/04 09:27:35 -0.09 0.04 -0.58
2018/03/04 09:27:36 -0.09 0.03 -0.58
2018/03/04 09:27:37 -0.09 0.06 -0.34
2018/03/04 09:27:38 -0.06 -0.02 -0.53
2018/03/04 09:27:39 -0.08 -0.01 -0.53
2018/03/04 09:27:40 -0.08 -0.01 -0.52
2018/03/04 09:27:41 -0.10 0.02 -0.32
2018/03/04 09:27:42 -0.09 -0.01 -0.29
2018/03/04 09:27:43 -0.08 -0.01 -0.43
2018/03/04 09:27:44 -0.09 -0.02 -0.43
2018/03/04 09:27:45 -0.02 -0.01 -0.48
2018/03/04 09:27:46 -0.01 0.08 -0.51
2018/03/04 09:27:47 -0.01 0.10 -0.52
2018/03/04 09:27:48 -0.00 0.11 -0.52
2018/03/04 09:27:49 0.00 0.12 -0.52
2018/03/04 09:27:50 0.01 0.13 -0.52
2018/03/04 09:27:51 0.01 0.13 -0.51
2018/03/04 09:27:52 0.01 0.13 -0.52
2018/03/04 09:27:53 0.01 0.13 -0.51
2018/03/04 09:27:54 0.01 0.14 -0.51
2018/03/04 09:27:55 -0.23 -0.62 -0.43
2018/03/04 09:27:56 -0.23 -0.67 -0.41
2018/03/04 09:27:57 -0.23 -0.66 -0.42
2018/03/04 09:27:58 -0.23 -0.65 -0.41
2018/03/04 09:27:59 -0.23 -0.66 -0.42
2018/03/04 09:28:00 -0.12 -0.61 -0.23
2018/03/04 09:28:01 -0.16 -0.50 -0.24
2018/03/04 09:28:02 -0.16 -0.50 -0.24
2018/03/04 09:28:03 -0.16 -0.50 -0.24
2018/03/04 09:28:04 -0.16 -0.50 -0.24
2018/03/04 09:28:05 -0.18 0.02 -0.40
2018/03/04 09:28:06 0.01 0.08 -0.55
2018/03/04 09:28:07 0.01 0.08 -0.55
2018/03/04 09:28:08 0.01 0.08 -0.56
2018/03/04 09:28:09 0.01 0.08 -0.56
2018/03/04 09:28:10 0.02 0.09 -0.56
2018/03/04 09:28:11 0.02 0.09 -0.56
2018/03/04 09:28:12 0.02 0.09 -0.56
2018/03/04 09:28:13 0.02 0.09 -0.56
2018/03/04 09:28:14 0.02 0.09 -0.56
2018/03/04 09:28:15 -0.05 -0.08 -0.57
2018/03/04 09:28:16 -0.29 -0.73 -0.38
2018/03/04 09:28:17 -0.28 -0.70 -0.40
2018/03/04 09:28:18 -0.27 -0.69 -0.40
2018/03/04 09:28:19 -0.27 -0.69 -0.40
2018/03/04 09:28:20 -0.17 -0.57 -0.29
2018/03/04 09:28:21 -0.16 -0.27 -0.31
2018/03/04 09:28:22 -0.16 -0.27 -0.31
2018/03/04 09:28:23 -0.16 -0.27 -0.31
2018/03/04 09:28:24 -0.16 -0.27 -0.31
2018/03/04 09:28:25 -0.20 -0.04 -0.33
2018/03/04 09:28:26 -0.00 0.09 -0.57
2018/03/04 09:28:27 0.01 0.09 -0.58
2018/03/04 09:28:28 0.01 0.09 -0.58
2018/03/04 09:28:29 0.02 0.09 -0.58
2018/03/04 09:28:30 0.03 0.10 -0.58
2018/03/04 09:28:31 0.03 0.10 -0.58
2018/03/04 09:28:32 0.03 0.10 -0.58
2018/03/04 09:28:33 0.04 0.10 -0.58
2018/03/04 09:28:34 0.04 0.10 -0.58
2018/03/04 09:28:35 0.04 0.10 -0.58
2018/03/04 09:28:36 -0.27 -0.64 -0.48
2018/03/04 09:28:37 -0.26 -0.62 -0.48
2018/03/04 09:28:38 -0.26 -0.61 -0.48
2018/03/04 09:28:39 -0.18 -0.17 -0.34
2018/03/04 09:28:40 -0.17 -0.15 -0.35
2018/03/04 09:28:41 -0.17 -0.15 -0.35
2018/03/04 09:28:42 -0.17 -0.15 -0.35
2018/03/04 09:28:43 -0.17 -0.14 -0.34
2018/03/04 09:28:44 -0.17 -0.14 -0.35
2018/03/04 09:28:45 -0.17 -0.16 -0.35
2018/03/04 09:28:46 -0.01 0.09 -0.58
2018/03/04 09:28:47 -0.01 0.11 -0.57
2018/03/04 09:28:48 -0.01 0.12 -0.57
2018/03/04 09:28:49 -0.00 0.12 -0.58
2018/03/04 09:28:50 0.00 0.12 -0.58
2018/03/04 09:28:51 0.00 0.12 -0.58
2018/03/04 09:28:52 0.01 0.12 -0.58
2018/03/04 09:28:53 0.01 0.12 -0.58
2018/03/04 09:28:54 0.01 0.12 -0.59
2018/03/04 09:28:55 0.01 0.13 -0.59
2018/03/04 09:28:56 -0.34 -0.71 -0.41
2018/03/04 09:28:57 -0.33 -0.68 -0.43
2018/03/04 09:28:58 -0.33 -0.68 -0.43
2018/03/04 09:28:59 -0.20 -0.56 -0.25
2018/03/04 09:29:00 -0.15 -0.04 -0.29
2018/03/04 09:29:01 -0.15 -0.03 -0.29
2018/03/04 09:29:02 -0.15 -0.03 -0.29
2018/03/04 09:29:03 -0.15 -0.03 -0.29
2018/03/04 09:29:04 -0.15 -0.03 -0.29
2018/03/04 09:29:05 -0.15 -0.03 -0.29
2018/03/04 09:29:06 -0.03 0.07 -0.61
2018/03/04 09:29:07 -0.03 0.09 -0.60
2018/03/04 09:29:08 -0.03 0.09 -0.60
2018/03/04 09:29:09 -0.03 0.09 -0.61
2018/03/04 09:29:10 -0.03 0.10 -0.61
2018/03/04 09:29:11 -0.02 0.10 -0.61
2018/03/04 09:29:12 -0.02 0.10 -0.61
2018/03/04 09:29:13 -0.02 0.10 -0.61
2018/03/04 09:29:14 -0.02 0.10 -0.61
2018/03/04 09:29:15 -0.02 0.10 -0.61
2018/03/04 09:29:16 -0.36 -0.73 -0.39
2018/03/04 09:29:17 -0.35 -0.69 -0.42
2018/03/04 09:29:18 -0.34 -0.69 -0.43
2018/03/04 09:29:19 -0.34 -0.68 -0.43
2018/03/04 09:29:20 -0.34 -0.67 -0.44
2018/03/04 09:29:21 -0.34 -0.67 -0.44
2018/03/04 09:29:22 -0.33 -0.67 -0.44
2018/03/04 09:29:23 -0.13 -0.07 -0.33
2018/03/04 09:29:24 -0.13 0.03 -0.34
2018/03/04 09:29:25 -0.13 0.03 -0.34
2018/03/04 09:29:26 -0.12 0.04 -0.24
2018/03/04 09:29:27 -0.06 0.06 -0.61
2018/03/04 09:29:28 -0.06 0.05 -0.60
備考
コマンドごとに1万測定ぐらいすれば、TensorFlowで十分な精度のコマンド識別ができるはず。。。
面倒である。
order_gesture_180225.pyの終了(finished)時にudpGraph_180218.ipynbのログ機能が自動停止しないので面倒である。
Inter-proces Communicationは運用に不便だろう。ファイルを生成して、それを検知する仕組みなどは簡単だろうか。