Introduction to NumPy | SciPy 2015 Tutorial | Eric Jones
https://www.youtube.com/watch?v=1zmV8lZsHF4&t=2198s
25:40あたりからMatplotlibの使い方の紹介がある。
自分が使ってこなかった機能がいくつか紹介されている。
知らなかったこと。
-
https://matplotlib.org/gallery.html
- 描画例とコードが紹介されている
- 自分の目的にあった描画を探してコードを学ぶことができる
-
ion()
-
グラフだけ別のウィンドウに表示され、そこにはツールメニュー?がいくつかある
- MacOS X上の環境での動作? Ubuntuでもどうか?
- 3D表示のview?変更は便利そうだった
-
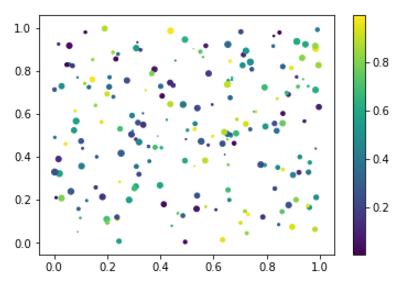
scatter()の使い方
- list objectを渡してplotする方法 (36:00あたり)
x = rand(200)y = rand(200)size = rand(200)*30color = rand(200)scatter(x, y, size, color)colorbar()
- 自前で二次元配列を作り、plt.imshow()に渡して描画する方法よりも使いやすいか?
- list objectを渡してplotする方法 (36:00あたり)
scatter
上記のコードをJupyterで試してみた。
DataStandarization_170812.ipynb
%matplotlib inline

import numpy as np
import matplotlib.pyplot as plt

x = np.random.rand(200)
y = np.random.rand(200)
size = np.random.rand(200) * 30
color = np.random.rand(200)
plt.scatter(x, y, size, color)
plt.colorbar()