動作環境
Xeon E5-2620 v4 (8コア) x 2
32GB RAM
CentOS 6.8 (64bit)
NCAR Command Language Version 6.3.0
for WRF3.7.1, WPS3.7.1
  openmpi-1.8.x86_64 とその-devel
  mpich.x86_64 3.1-5.el6とその-devel
  gcc version 4.4.7 (とgfortran)
for WRF3.9, WPS3.9
  Open MPI v2.1.1
  gcc version 4.9.2 (とgfortran; devtoolset-3使用)
 NetCDF v4.4.1.1, NetCDF (Fortran API) v4.4.4
Python 2.6.6 (r266:84292, Aug 18 2016, 15:13:37)
Python 3.6.0 on virtualenv
GNU bash, version 4.1.2(1)-release (x86_64-redhat-linux-gnu)
date (GNU coreutils) 8.4
tmux 1.6-3.el6
WRF(Weather Research and Forecasting Model)とその前処理であるWPS、およびWRFの後続処理のF***T関連。
WRF実行後のwrfout***ファイルから緯度経度情報を取得する。
- ncdumpを使う
- 取得サイズは対象範囲のサイズ 75 x 75
code
CODE_171116/extract_XLAT_XLONG_180228_exec
# !/usr/bin/env bash
set -eu  # just in case

# 5625 = 75 x 75 (west_east * south_north)

WRF_D02=$1

ncdump -v XLAT $WRF_D02 | grep -A 2000 "XLAT =" | tr ", " "\n" | grep "\." | head -n 5625 > dat.XLAT
ncdump -v XLONG $WRF_D02 | grep -A 2000 "XLONG =" | tr ", " "\n" | grep "\." | head -n 5625 > dat.XLONG
$ bash CODE_171116/extract_XLAT_XLONG_180228_exec wrfout_d02_2017-11-01_00\:00\:00
[dat.XLAT] is created
[dat.XLONG] is created
- 1行に6個程度のカンマ付き数値列からtrで改行している
- grep -A 2000の2000は5625/6を超える任意の数値でいい
出力ファイル
以下のような5625行のファイルが出力される。
$ head dat.XLAT
30.58262
30.58724
30.59171
30.59607
30.60028
30.60435
30.6083
30.61209
30.61576
30.61929
Matplotlibでの表示
上記のファイルをJupyter + MatplotlibをセットアップしたUbuntuへコピーした。
動作環境
Ubuntu 16.04.3 LTS desktop amd64
IPython 6.2.1 -- An enhanced Interactive Python. Type '?' for help.
tmux 2.1-3build1
Python 2.7.12
Python 3.5.2
関連: Jupyter | Matplotlib > 2次元データの可視化 > imshow() | scatter()
code v0.1
mapLatitudeLongitude_WRF_180228.ipynb
%matplotlib inline
import numpy as np
import matplotlib.pyplot as plt
lat = np.genfromtxt('dat.XLAT')
lon = np.genfromtxt('dat.XLONG')
print(lat)
print(lon)
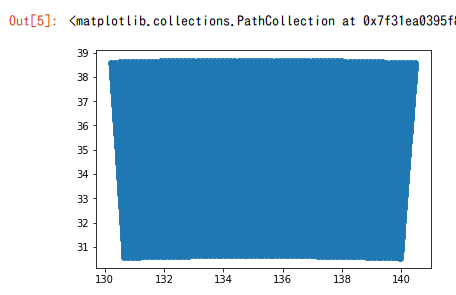
plt.scatter(lon, lat)
code v0.2 > 参照地点の追加
mapLatitudeLongitude_WRF_180228.ipynb
%matplotlib inline
import numpy as np
import matplotlib.pyplot as plt
# import matplotlib.cm as cm
lat = np.genfromtxt('dat.XLAT')
lon = np.genfromtxt('dat.XLONG')
print(lat)
print(lon)
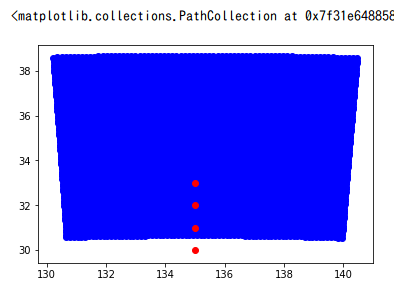
plt.scatter(lon, lat, color='blue')
regx = np.array([135.0, 135.0, 135.0, 135.0])
regy = np.array([30.0, 31.0, 32.0, 33.0])
plt.scatter(regx, regy, color='red')
code v0.3
コードは未掲載とするが、以下の処理を追加した。
- calc_region()という関数を追加
- regx[]とregy[]に
F***Tの4隅の緯度経度を計算し、tupleで返す
- regx[]とregy[]に
この処理にてF***Tの範囲がWRFのデータ範囲に収まらないことが可視化できるようになった。
Lambertでのprojectionにより、緯度経度の範囲が収まらないようになったのかもしれない。
可視化は大切
データが範囲内にあるかどうかは数値だけ見ても把握しにくい。
将来同じような処理を行う場合、短時間で失敗が分かる仕組みを作っておく方がよいと思う。