動作環境
GeForce GTX 1070 (8GB)
ASRock Z170M Pro4S [Intel Z170chipset]
Ubuntu 16.04 LTS desktop amd64
TensorFlow v1.1.0
cuDNN v5.1 for Linux
CUDA v8.0
Python 3.5.2
IPython 6.0.0 -- An enhanced Interactive Python.
gcc (Ubuntu 5.4.0-6ubuntu1~16.04.4) 5.4.0 20160609
GNU bash, version 4.3.48(1)-release (x86_64-pc-linux-gnu)
Matplotlibを使い、三次元のデータをスライスして二次元データとして表示したいことがある。
2つの方法がありそうだ。
- imshow()使用
- scatter()使用
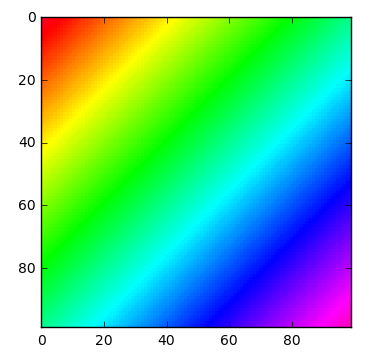
imshow()使用
Jupyter / matplotlib > 2Dの数値を画像化
上記のリンクから描画部分だけ抜粋。2d.csvファイルが必要。
import numpy as np
import matplotlib.pyplot as plt
import matplotlib.cm as cm

x,y,temp = np.loadtxt('2d.csv').T #Transposed for easier unpacking
nrows, ncols = 100, 100
grid = temp.reshape((nrows, ncols))

plt.imshow(grid, extent=(x.min(), x.max(), y.max(), y.min()),
           interpolation='nearest', cmap=cm.gist_rainbow)
plt.show()
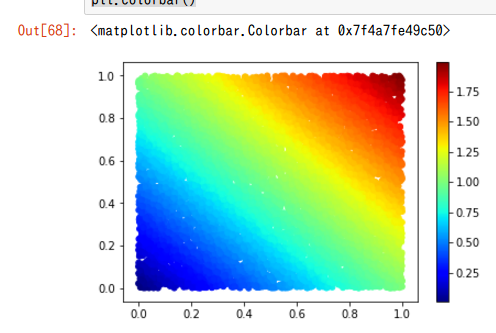
scatter()使用
test_scatter_170812.ipynb
%matplotlib inline

import numpy as np
import matplotlib.pyplot as plt
import matplotlib.cm as cm


def get_value(ax, ay):
    return ax + ay

# 1. get data
NUM_DATA = 10000
x = np.random.rand(NUM_DATA)
y = np.random.rand(NUM_DATA)
color = get_value(x, y)

# 2. draw data
size = 25  # arbitrary
plt.scatter(x, y, size, color, cmap=cm.jet)
plt.colorbar()
備考
用途によって使いやすい方を使うのが良いだろう。
X座標の定義が反対なのか、左右反転している。

