0
0

Delete article

Deleted articles cannot be recovered.

Draft of this article would be also deleted.

Are you sure you want to delete this article?

More than 5 years have passed since last update.

Matplotlibのcolorbarに複数の値を割り当てる方法

0
Posted at

とりあえず、こうしました。
cbar.ax.set_yticklabelsticksでラベルを変更しているが、全ての値が適用されなかったりする。
正規のやり方あったら教えてほしいです。

pic.png

import matplotlib.pyplot as plt
import numpy as np 
plt.rcParams['font.size']=18

# もとの値から表示したい値を返すの関数
def convert(org):
    return org*org


rand=np.random.rand(100, 100)*1e4
max=rand.max()
fig = plt.figure(figsize=(7,5))
ax = fig.add_subplot(111)
im=ax.imshow(rand,cmap='gray')

# ここからカラーバー
cbar=fig.colorbar(im, ax=ax,pad=0.02,shrink=1.0,ticks = [0,max/4,max/2,3*max/4, max])
ticks = cbar.get_ticks()
new_ticks=[]
for t in ticks:
    new_ticks.append(str(t.round(-3))+'/'+str(convert(t).round(-3)))
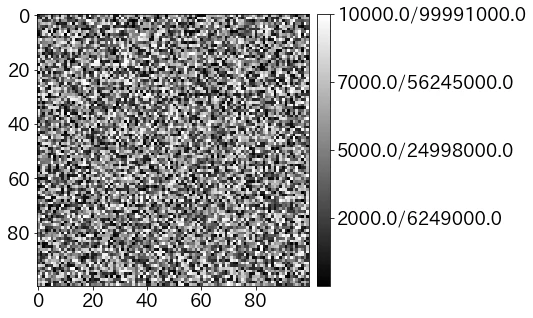
cbar.ax.set_yticklabels(new_ticks)
plt.show()

0
0
0

Register as a new user and use Qiita more conveniently

  1. You get articles that match your needs
  2. You can efficiently read back useful information
  3. You can use dark theme
What you can do with signing up
0
0

Delete article

Deleted articles cannot be recovered.

Draft of this article would be also deleted.

Are you sure you want to delete this article?