この記事では、Alex MesoudiのRで書かれたチュートリアルをpythonに翻訳する。
下記の記事ではバイアスのある伝達についてのモデルが紹介されている。
文化的形質の伝達におけるバイアスは直接・内容バイアスと間接バイアスの二種類がある。前者は、文化形質がより記憶に残りやすい、発音しやすいなどの理由から他の文化形質と比べて伝達されやすい傾向のことを指し、後者は文化形質の持ち主の特性によって伝達されやすくなる傾向のことを指す。本稿では、前者をモデル化する
エージェントベースシミュレーション
まずは、必要なライブラリをインストールする。
python
import pandas as pd
import numpy as np
import random
import math
import matplotlib.pyplot as plt
!pip install japanize-matplotlib
import japanize_matplotlib
コードは次のようになる。
python
def biased_transmission(N, s, p_0, t_max, r_max):
    output = pd.DataFrame(np.tile(float('nan'), (t_max, r_max)))
    output.columns = ["run_" +  str(i) for i in range(r_max)]
    for r in range(r_max):
        agent = pd.DataFrame(random.choices(["A", "B"], k=N,  weights=[p_0, 1 - p_0]), columns = ["trait"])
        output.iloc[0, r] = sum(agent["trait"] == "A") / N

        for t in range(1, t_max):
            previous_agent = agent.copy()

            demonstrator_trait = pd.DataFrame(random.sample(agent["trait"].to_list(), N), columns = ["trait"])
            copy = np.random.rand(N)
            agent[np.logical_and(demonstrator_trait["trait"] == "A", copy < s)] = "A"

            output.iloc[t, r] = sum(agent["trait"] == "A") / N

    plt.figure(figsize=(10, 5), dpi=100)
    plt.plot(output)
    plt.title(f'N = {N}, s = {s}')
    plt.xlabel('世代数')
    plt.ylabel("形質Aを持つエージェントの割合")
    plt.xlim([0, t_max])
    plt.ylim([0, 1])
    plt.show()
p_0を0.01として形質Aが極めて少ない初期値で、シミュレーションしてみる。
python
biased_transmission(N = 10000, s = 0.1, p_0 = 0.01, t_max = 150, r_max = 5)
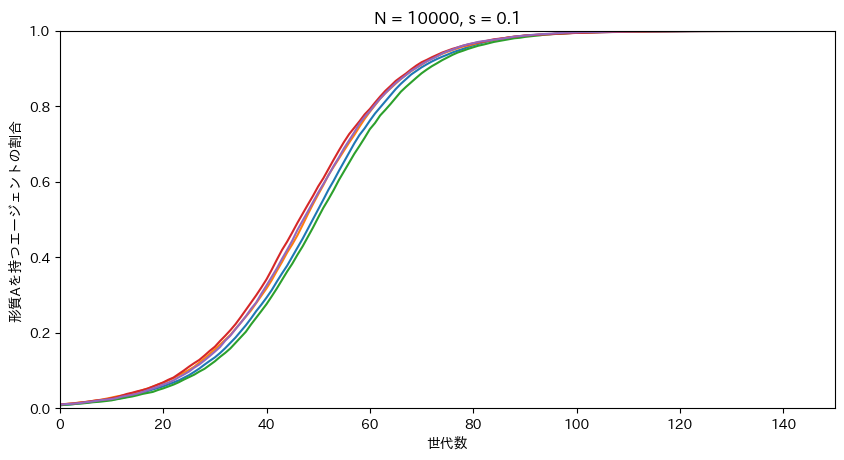
シミュレーションの結果、初期状態において形質が極めて少ない割合でも、形質が他の形質と比べて有利であるならば世代を経るごとに人口の大部分を占めていくことが見て取れる。
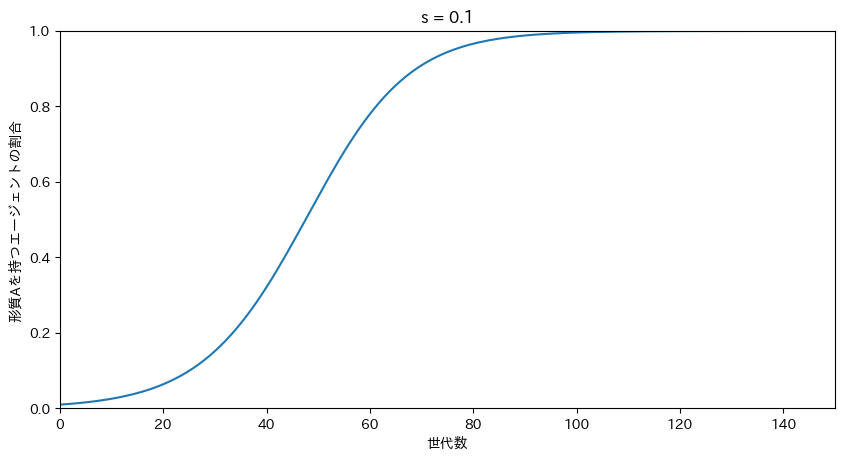
数値シミュレーション
数値シミュレーションの場合、次のようになる。
p′=p+p(1−p)s
python
p = np.repeat(float(0), 150)
p[0] = 0.01
s = 0.1

for i in range(1,150):
    p[i] = p[i-1] + p[i-1]*(1-p[i-1])*s


plt.figure(figsize=(10, 5), dpi=100)
plt.plot(p)
plt.title(f's = {s}')
plt.xlabel('世代数')
plt.ylabel("形質Aを持つエージェントの割合")
plt.xlim([0, 150])
plt.ylim([0, 1])
plt.show()