
はじめに
国土数値情報では、将来推計人口データが公開されています。
そこで、将来推計人口データを地図上で可視化し、年度ごとの変化を確認できるビューアを作成してみます。
今回は首都圏の変化を確認しやすくするため、埼玉県、千葉県、東京都、神奈川県のデータを使用します。
使用するデータ
今回使用するのは、国土数値情報が公開している「1kmメッシュ別将来推計人口データ(R6国政局推計)」です。
このデータは令和2年国勢調査をもとに、2070年までの将来人口を推計したものです。
データには総人口だけでなく、男女別や年齢階級別の推計値も含まれています。
今回は総人口を使用します。
データのダウンロードはこちらです。
今回は以下の4ファイルを使用しました。
- 埼玉県(1km_mesh_2024_11.geojson)
- 千葉県(1km_mesh_2024_12.geojson)
- 東京都(1km_mesh_2024_13.geojson)
- 神奈川県(1km_mesh_2024_14.geojson)
完成イメージ
完成すると以下のようになります。
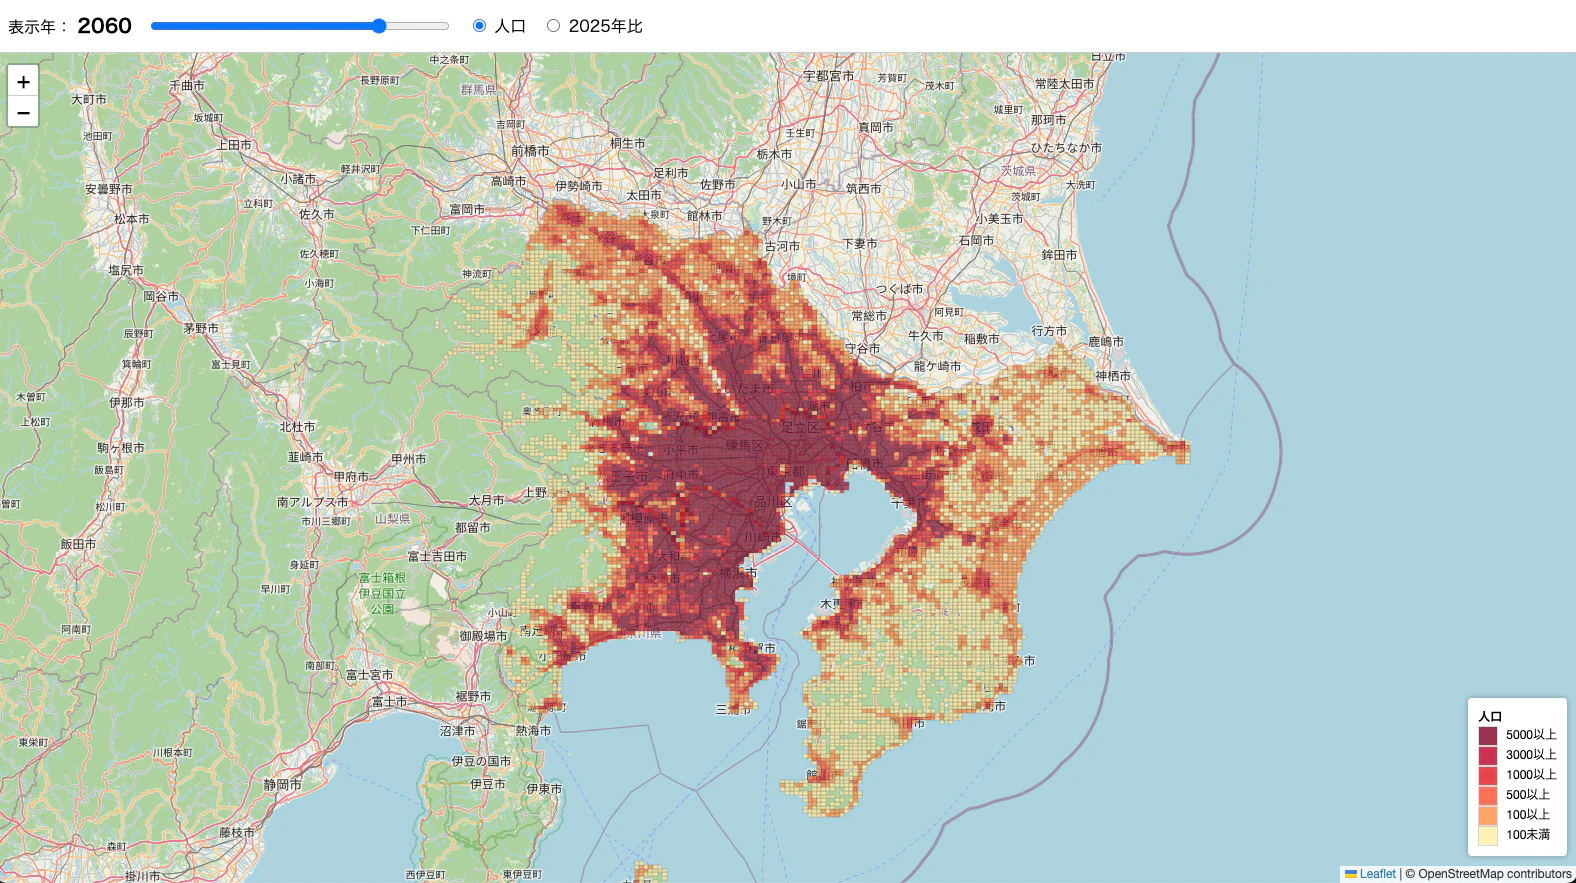
人口モードでは指定した年度の人口を表示できます。
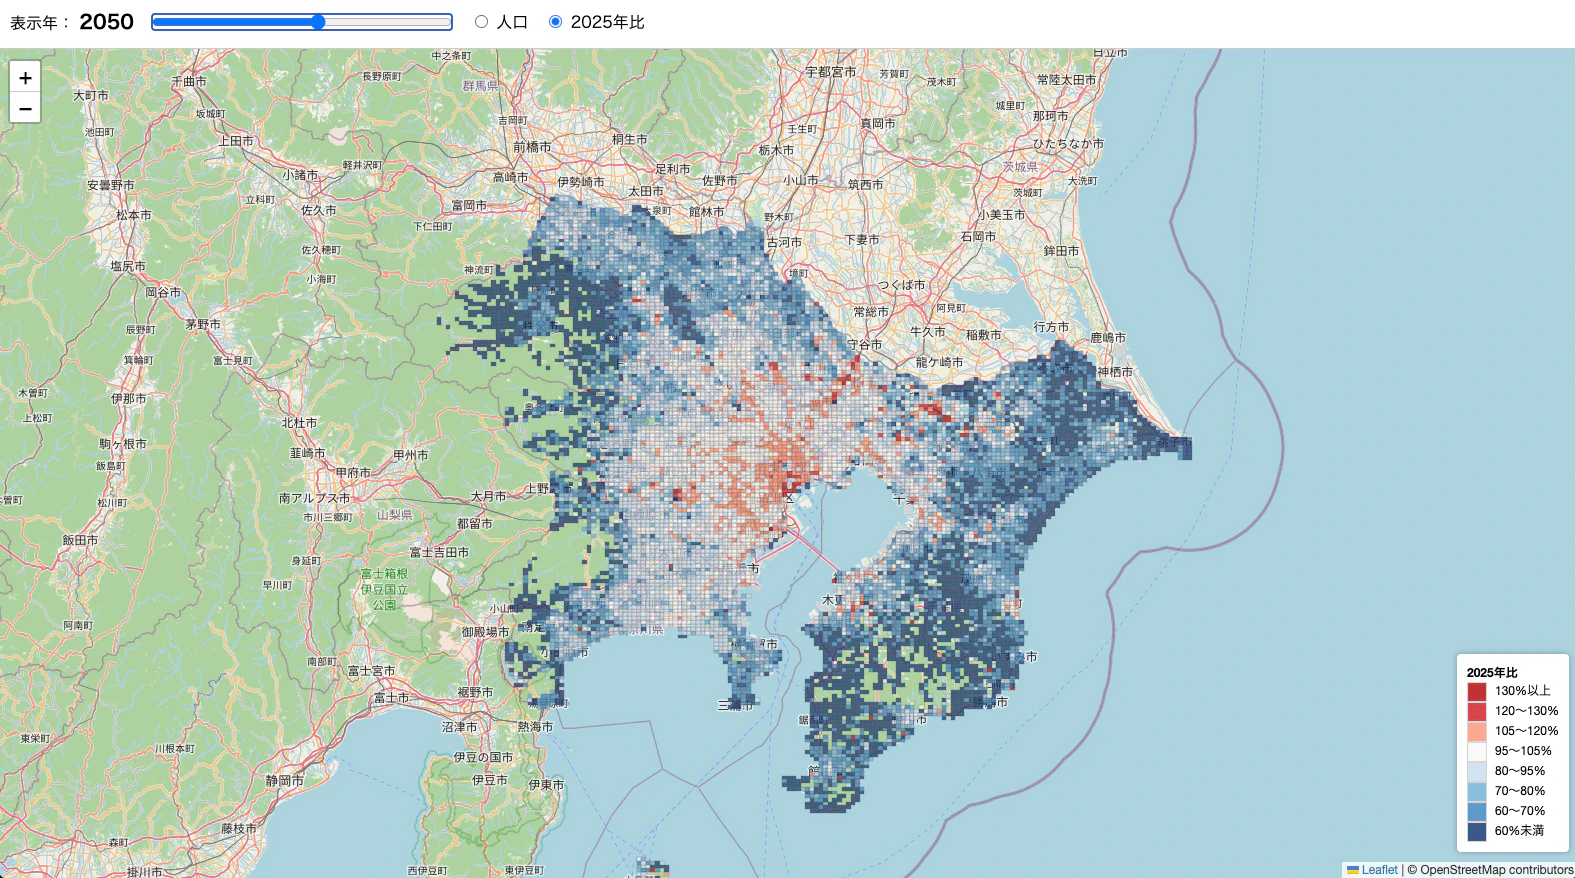
また、2025年比モードへ切り替えることで、人口の増減傾向も確認できます。
プロジェクト構成
今回の構成は以下の通りです。
mesh-population-viewer/
├─ index.html
└─ data/
   ├─ 1km_mesh_2024_11.geojson
   ├─ 1km_mesh_2024_12.geojson
   ├─ 1km_mesh_2024_13.geojson
   └─ 1km_mesh_2024_14.geojson
HTMLファイル1つで実装しています。
実装
今回はHTMLファイル1つで実装しました。
以下が全体コードです。
<!doctype html>
<html lang="ja">
<head>
<meta charset="utf-8" />
<meta name="viewport" content="width=device-width, initial-scale=1" />
<title>将来推計人口ビューア</title>
<link rel="stylesheet" href="https://unpkg.com/leaflet@1.9.4/dist/leaflet.css" />
<style>
html,
body {
margin: 0;
padding: 0;
height: 100%;
font-family: sans-serif;
}
#container {
display: flex;
flex-direction: column;
height: 100%;
}
#toolbar {
padding: 12px;
background: #ffffff;
border-bottom: 1px solid #cccccc;
display: flex;
flex-wrap: wrap;
gap: 16px;
align-items: center;
}
#map {
flex: 1;
}
#yearLabel {
font-size: 1.2rem;
font-weight: bold;
}
input[type="range"] {
width: 300px;
}
.legend {
background: white;
padding: 10px;
line-height: 1.5;
border-radius: 4px;
box-shadow: 0 0 6px rgba(0, 0, 0, 0.3);
}
.legend i {
display: inline-block;
width: 18px;
height: 18px;
margin-right: 8px;
opacity: 0.8;
vertical-align: middle;
}
</style>
</head>
<body>
<div id="container">
<div id="toolbar">
<div>
表示年:
<span id="yearLabel">2025</span>
</div>
<input type="range" id="yearSlider" min="2025" max="2070" step="5" value="2025" />
<label>
<input type="radio" name="mode" value="population" checked />
人口
</label>
<label>
<input type="radio" name="mode" value="ratio" />
2025年比
</label>
</div>
<div id="map"></div>
</div>
<script src="https://unpkg.com/leaflet@1.9.4/dist/leaflet.js"></script>
<script>
// 地図を初期化し、首都圏が収まるよう表示位置を設定する
const map = L.map("map");
map.setView([35.681236, 139.767125], 9);
L.tileLayer("https://tile.openstreetmap.org/{z}/{x}/{y}.png", {
attribution: "© OpenStreetMap contributors",
}).addTo(map);
const yearLabel = document.getElementById("yearLabel");
const yearSlider = document.getElementById("yearSlider");
// 現在の表示モード("population": 人口 / "ratio": 2025年比)
let displayMode = "population";
// 読み込んだGeoJSONデータとLeafletレイヤーを保持する変数
let geojsonData = null;
let geojsonLayer = null;
// 都道府県ごとに分かれたGeoJSONファイルのパス一覧
const files = ["./data/1km_mesh_2024_11.geojson", "./data/1km_mesh_2024_12.geojson", "./data/1km_mesh_2024_13.geojson", "./data/1km_mesh_2024_14.geojson"];
// GeoJSONの属性名は「PTN_西暦年」の形式(例: PTN_2025)になっている
function getPopulation(feature, year) {
return Number(feature.properties[`PTN_${year}`]) || 0;
}
// 2025年の人口を基準として、指定年の人口比率(%)を算出する
function getRatio(feature, year) {
const base = Number(feature.properties["PTN_2025"]) || 0;
const current = Number(feature.properties[`PTN_${year}`]) || 0;
if (base === 0) return 0;
return (current / base) * 100;
}
// 人口の多さを赤系の色で表現する(人口が多いほど濃い赤)
function getPopulationColor(value) {
if (value >= 5000) return "#800026";
if (value >= 3000) return "#BD0026";
if (value >= 1000) return "#E31A1C";
if (value >= 500) return "#FC4E2A";
if (value >= 100) return "#FD8D3C";
return "#FFEDA0";
}
// 人口増加を赤、ほぼ横ばいを白、人口減少を青で表現する
function getRatioColor(value) {
if (value >= 130) return "#b30000";
if (value >= 120) return "#cb181d";
if (value >= 105) return "#fc9272";
if (value >= 95) return "#f7f7f7";
if (value >= 80) return "#c6dbef";
if (value >= 70) return "#6baed6";
if (value >= 60) return "#3182bd";
return "#08306b";
}
// 年度を受け取り、GeoJSONレイヤーを再描画する
// 年度切り替えのたびに既存レイヤーを削除して新たに追加する
function renderLayer(year) {
if (geojsonLayer) {
map.removeLayer(geojsonLayer);
}
geojsonLayer = L.geoJSON(geojsonData, {
style: (feature) => {
let fillColor;
if (displayMode === "population") {
const population = getPopulation(feature, year);
fillColor = getPopulationColor(population);
} else {
const ratio = getRatio(feature, year);
fillColor = getRatioColor(ratio);
}
return {
color: "#666",
weight: 0.3,
fillColor,
fillOpacity: 0.7,
};
},
// メッシュクリック時に人口・増減率を表示するポップアップを設定する
onEachFeature: (feature, layer) => {
const population = getPopulation(feature, year);
const ratio = getRatio(feature, year);
const changeRate = ratio - 100;
layer.bindPopup(`
<table>
<tr>
<th align="left">メッシュID</th>
<td>${feature.properties.MESH_ID}</td>
</tr>
<tr>
<th align="left">年</th>
<td>${year}</td>
</tr>
<tr>
<th align="left">人口</th>
<td>${population.toLocaleString()} 人</td>
</tr>
<tr>
<th align="left">2025年比</th>
<td>${ratio.toFixed(1)} %</td>
</tr>
<tr>
<th align="left">増減率</th>
<td>${changeRate > 0 ? "+" : ""}${changeRate.toFixed(1)} %</td>
</tr>
</table>
`);
},
}).addTo(map);
}
// 凡例コントロールを地図右下に追加する
const legend = L.control({ position: "bottomright" });
legend.onAdd = function () {
const div = L.DomUtil.create("div", "legend");
updateLegend(div);
return div;
};
legend.addTo(map);
// 表示モードに応じて凡例の内容を切り替える
function updateLegend(element) {
if (displayMode === "population") {
element.innerHTML = `
<strong>人口</strong><br>
<i style="background:#800026;border:1px solid #ccc"></i>5000以上<br>
<i style="background:#BD0026;border:1px solid #ccc"></i>3000以上<br>
<i style="background:#E31A1C;border:1px solid #ccc"></i>1000以上<br>
<i style="background:#FC4E2A;border:1px solid #ccc"></i>500以上<br>
<i style="background:#FD8D3C;border:1px solid #ccc"></i>100以上<br>
<i style="background:#FFEDA0;border:1px solid #ccc"></i>100未満
`;
} else {
element.innerHTML = `
<strong>2025年比</strong><br>
<i style="background:#b30000;border:1px solid #ccc"></i>130%以上<br>
<i style="background:#cb181d;border:1px solid #ccc"></i>120~130%<br>
<i style="background:#fc9272;border:1px solid #ccc"></i>105~120%<br>
<i style="background:#f7f7f7;border:1px solid #ccc"></i>95~105%<br>
<i style="background:#c6dbef;border:1px solid #ccc"></i>80~95%<br>
<i style="background:#6baed6;border:1px solid #ccc"></i>70~80%<br>
<i style="background:#3182bd;border:1px solid #ccc"></i>60~70%<br>
<i style="background:#08306b;border:1px solid #ccc"></i>60%未満
`;
}
}
// 複数のGeoJSONを並列で取得し、全件完了後に1つのFeatureCollectionとしてまとめて描画する
Promise.all(files.map((file) => fetch(file).then((response) => response.json())))
.then((results) => {
geojsonData = {
type: "FeatureCollection",
features: results.flatMap((item) => item.features),
};
renderLayer(Number(yearSlider.value));
})
.catch((error) => {
console.error(error);
alert("GeoJSONの読み込みに失敗しました");
});
// スライダー操作で表示年度を切り替える
yearSlider.addEventListener("input", () => {
const year = Number(yearSlider.value);
yearLabel.textContent = year;
if (geojsonData) {
renderLayer(year);
}
});
// ラジオボタン切り替えで表示モードを変更し、凡例とレイヤーを更新する
document.querySelectorAll('input[name="mode"]').forEach((radio) => {
radio.addEventListener("change", (event) => {
displayMode = event.target.value;
const legendElement = document.querySelector(".legend");
updateLegend(legendElement);
renderLayer(Number(yearSlider.value));
});
});
</script>
</body>
</html>
実装上のポイントをいくつか見ていきます。
複数のGeoJSONをまとめて読み込む
将来推計人口データは都道府県ごとにファイルが分かれています。
今回は首都圏をまとめて表示したかったため、4つのGeoJSONを読み込み、1つの FeatureCollection として扱っています。
Promise.all を利用することで、複数ファイルの読み込み完了後にまとめて処理できます。
人口モードと2025年比モードを切り替える
人口データをそのまま表示すると、東京都心部や横浜市周辺は常に人口が多いため、年度を切り替えても変化が分かりにくいことがあります。
そこで2025年を基準として人口比率を計算し、人口増加地域を赤、人口減少地域を青で表示するモードを追加しました。
2025年比モードに切り替えると、人口の増減傾向が把握しやすくなります。
スライダーで年度を切り替える
GeoJSONには以下のような属性が格納されています。
- PTN_2025
- PTN_2030
- PTN_2035
- ...
- PTN_2070
スライダーで年度を選択し、その年度に対応する属性を参照することで、人口推移を確認できるようにしています。
おわりに
今回は国土数値情報の将来推計人口データを利用して、将来人口の推移を確認できるビューアを作成してみました。
人口そのものを表示するだけでなく、2025年比で表示することで、地域ごとの変化も把握しやすくなります。
また、GeoJSON形式で公開されているため、Leafletと組み合わせることで比較的手軽に可視化できます。
今回は首都圏の4都県を対象としましたが、他の都道府県のデータでも同様に利用できます。
将来人口データがどのように変化していくのか、地図上で眺めてみるだけでも新しい発見があるかもしれません。