この記事は、2020年度卒のDMMグループ内定者が寄ってたかって記事を書くアドベントカレンダーに合わせて書いたものです。
DMMグループ '20卒内定者 Advent Calendar 2019
もうちょっと、自己紹介とか書いたらよかったかなとか、下の内容を書いた後になって後悔しているのですが、プラネタリウム開発は自分の学生生活の中でかなり中核的な活動だったので、この記事に代えて自己紹介とさせていただきます。
0. 概要
腐れ縁で所属いている某サークルが例年通り、高専祭でプラネタリウムを展示することなり、僕がその光源装置の製作に必要な恒星原盤を製作することになりました。(恒星原盤に出力する恒星の座標変換等一切は、弊学の超超超優秀な後輩くんがやってくれました。僕&本記事は、それを点描するだけです。)
以前にも同様の原盤をJavaとGnuplotで出力したことがあったのですが、なんだかビミョーな仕上がりになってしまいました。Gnuplotはグラフの表示ツールであるため、プラネタリウムの星のように細かい点を出力することが苦手なようです。
そこで、今回は心機一転、もっと低レベルな画像処理ライブラリであるcairoのPythonラッパーPycairoを用いて、恒星原盤を出力することにしました。
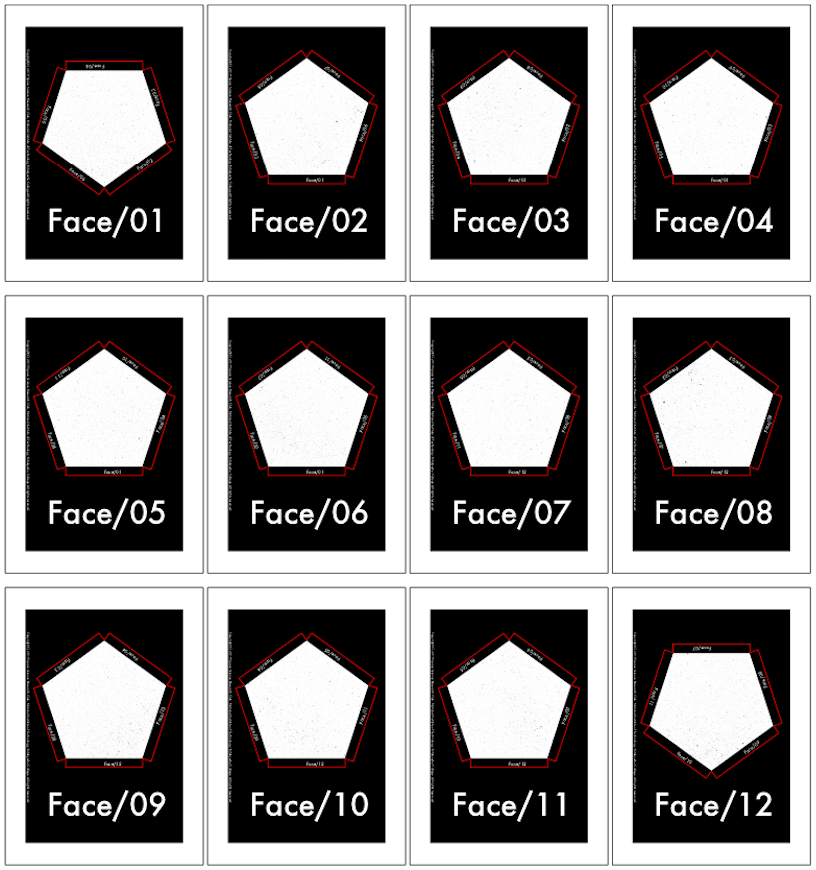
描画したもの(の1ページ目)を以下に示します。
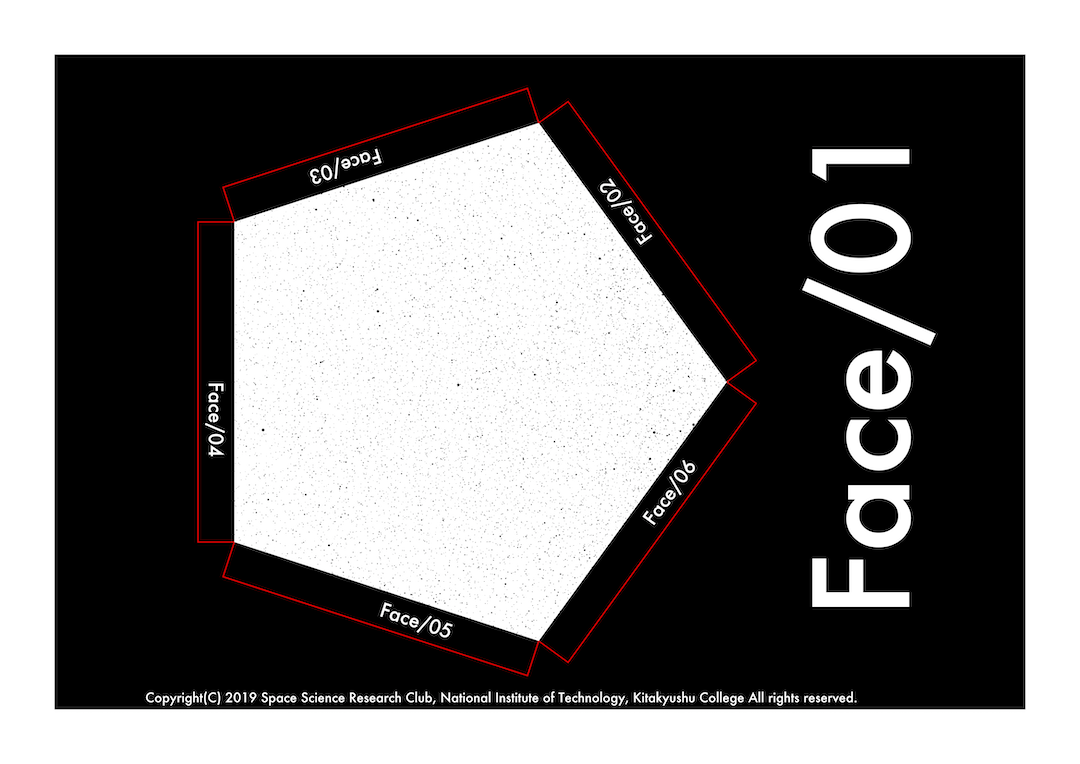
このpdf形式(JIS A4サイズ x12枚)をOHPシートと呼ばれる透明な印刷用紙に印刷した上で、これをリスフィルムと呼ばるコントラスト性能の高いフィルムに現像することで、ピンホール式プラネタリウム光源装置のフィルタを作成することができます。
このフィルムを作成することが今回の目標になりことが今回の目標になります。
1. cairo? Pycairo?
1.1. cairoとは
cairoとは、2Dのベクターイメージを描画するための低レベル気味なライブラリ
調べてみると、様々な主要ossにて利用されている様子。
1.2. Pycairoとは
先述の通り、PycairoはcairoのPythonラッパーです。
このPycairoですが、日本語ドキュメントが比較的少ないように感じます。まあ、英語ドキュメントはネットのそこら中に転がっているので情報量には困りませんが。
ネットで調べてもわからないことがあったら、このドキュメントたちを読んで色々試せばどうにかなります。特に、Cairo Tutorialを読めば、cairoライブラリそのものの動作原理が理解できますので必読です。
3. 環境構築
3.1. 下準備
python3とnumpyを導入してください。(手順は省略)
virtualenvとJupyter Notebook(Colaboratory拡張)の導入も推奨
3.2. Pycairoのインストール
別になんてことなく、下記コマンドで完了
pip install pycairo
4. Pycairoの使い方
恒星原盤の開発に利用した機能だけを列挙します。
4.1. 下準備
4.1.1. A4サイズを描画するために
JIS A4サイズは「210mm×297mm」と規定されており、メートル法で説明されていますが、一方でPycairoは最小単位である1ptが「1pt= 1/72th of 1in」と規定されており、ヤードポンド法に殺意を覚えるわけです。
そこで、仕方なく、メートル法とヤードポンド法の橋渡し的な関数を定義します。
def inch(meter):
  return 0.0393701 * meter * 72.0
4.1.2. rgb文字列のベクター化
Pycairoでは、RGB色情報をそれぞれ数値(0.0~1.0)で渡しますが、面倒なのでrgb文字列からベクターに直す関数も定義します。
def color(color_string):
  return np.array([int(color_string[1:3], 16), int(color_string[3:5], 16), int(color_string[5:7], 16)])
4.1.3. 基本的な描画
def draw_face(context, color_as_vector, width=100, height=100, margine=0):
  context.save()

  context.set_source_rgb(
      color_as_vector[0],
      color_as_vector[1],
      color_as_vector[2])
  context.translate(margine, margine) # 描画の基準となる座標(基準点)へ移動
  context.rectangle(0,0,width, height) # 基準点からの各パラメータを渡して描画
  context.fill()

  context.restore()

with cairo.PDFSurface("example.pdf", canvas_width, canvas_height) as surface:
  for face_num in range(12):
    context = cairo.Context(surface)
    context.scale(1, 1)

    draw_face(context,
              color_as_vector=color('#000000'),
              width=canvas_width-inch(30),
              height=canvas_height-inch(30),
              margine=inch(15))

    surface.show_page() # 新規ページの作成&切り替え
cairo.PDFSurfaceでPDFのオブジェクトを作成します。他にも、cairo.PSSurfaceやcairo.SVGSurface、cairo. ImageSurfaceなどがあります。
また、surface.show_pageはpdfにおいて同サイズのページを新規作成する機能です。
それから、図形を作成の処理をcontext.saveとcontext.restoreの間に記述することに注意しましょう。
4.1.4. ソースデータの用意
今回は、後輩くんからcsvファイルをいただいたので、それを恒星カタログのデータとして取り込みます。
def gen_star_catalogue(file_name=None, face_num=0):
  face_vector = [[] for _ in range(face_num)]

  with open(file_name, mode='r') as csv_file:
    for line in csv.reader(csv_file, delimiter=' '):
      face_vector[int(line[0])].append([ast.literal_eval(line[1]),
                                        ast.literal_eval(line[2]),
                                        ast.literal_eval(line[3])])

  for face in range(face_num):
      face_vector[face] = np.array(face_vector[face])

  return face_vector
4.2. 正多角形の作図
今回は正五角形の図を出力したのですがコードの柔軟性を高めるために、三角形以上の正多角形の頂点集合を出力するコードを実装します。
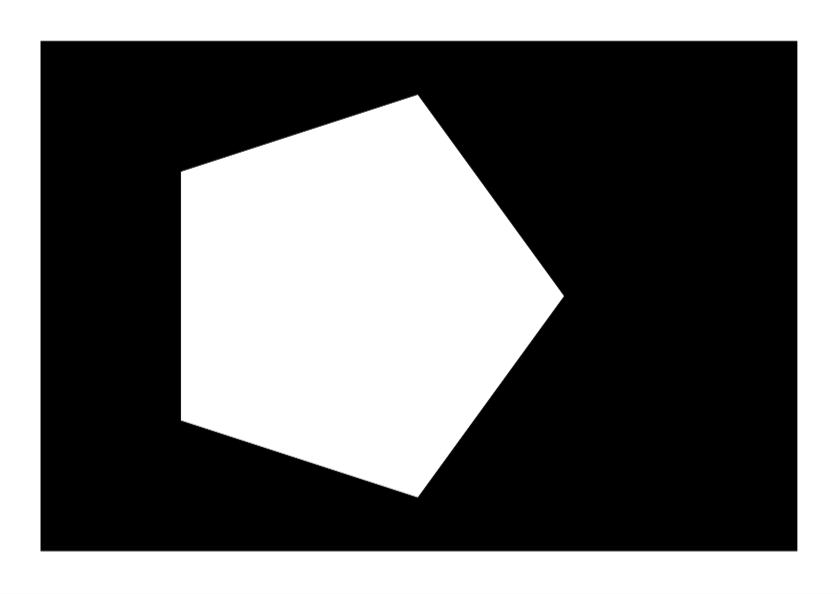
center_posを中心とした半径radiusの外接円を持つ正多角形を想定します。適当にn角形の各頂点の座標を計算し、それから、二次元上の任意の点で任意のraduisだけ回転させる回転行列を掛け合わせた頂点群を出力します。
def gen_regular_polygon(center_pos=None, n=3, radius=1, rotate=0):
  theta = 2 * math.pi / n
  rot_rad = 2 * math.pi * rotate / 360.0

  verts = np.array([[[math.cos(i*theta) * radius + center_pos[0]],
                     [math.sin(i*theta) * radius + center_pos[1]],
                     [1]]
                    for i in range(n)])

  rcos = math.cos(rot_rad)
  rsin = math.sin(rot_rad)
  r31 = -center_pos[0]*rcos + center_pos[1]*rsin + center_pos[0]
  r32 = -center_pos[0]*rsin - center_pos[1]*rcos + center_pos[1]

  rot_vec = np.array([[rcos, -rsin, r31],
                      [rsin, rcos, r32],
                      [0, 0, 1]])

  verts = np.concatenate([[np.dot(rot_vec, vert)] for vert in verts])

  verts = np.apply_along_axis(lambda x: np.array([x[0], x[1]]), arr=verts, axis=1).reshape([n, 2])

  return verts
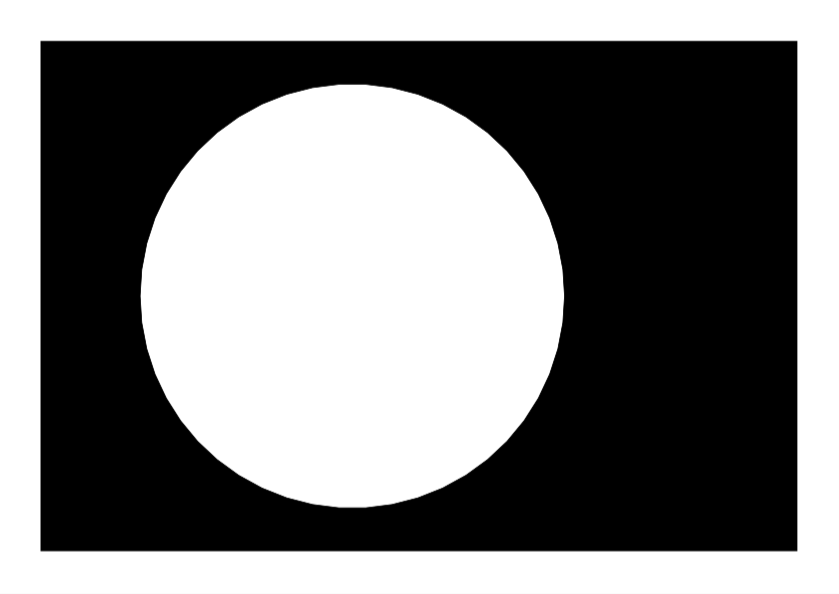
また、50角形にすると下の図のように、円に近いの多角形が描画されます。
4.3. のりしろの作成
数学の力でねじ伏せます。とはいっても簡単な数式しか使いません。
\vec{n}=\frac{\vec{oc}}{|\vec{oc}|}
\vec{m_a}=len\cdot\vec{n}+\vec{a}
\vec{m_b}=len\cdot\vec{n}+\vec{b}
あとは、これらを順に繋げて線を引けば、のりしろを作ることができます。
def draw_margines(context=None, verts=None, center_pos=None, edge_size=1, line_color_as_vec=None, frame_width=1, margin_face_num_list=None):
  vert_multi = verts.repeat(2, axis=0)
  vert_pairs = np.roll(vert_multi, -2).reshape([verts.shape[0], 2, verts.shape[1]])

  midpoints = np.apply_along_axis(func1d=lambda x: np.sum(a=x, axis=0)/2, axis=1, arr=vert_pairs)
  orth_vecs = midpoints - center_pos
  euclid_dists = np.mean(np.apply_along_axis(func1d=lambda x: np.linalg.norm(x), axis=1, arr=orth_vecs))

  normals = orth_vecs / euclid_dists
  normals_pairs = normals.repeat(2, axis=0).reshape([normals.shape[0], 2, 2])

  edges_arr = edge_size * normals_pairs + vert_pairs

  # [一辺の端A, 端A側の角, 端B側の角, 一辺の端B]の順に整列し、これをコンテキストに渡す
  edges_arr = np.array([[vert_pairs[x,0], edges_arr[x,0], edges_arr[x,1], vert_pairs[x,1]] for x in range(edges_arr.shape[0])])

  context.save()
  for edges in edges_arr:
    first_edge = edges[0]
    context.move_to(first_edge[0], first_edge[1])
    for edge in edges[1:]:
      context.line_to(edge[0], edge[1])
    context.set_source_rgb(line_color_as_vec[0],line_color_as_vec[1],line_color_as_vec[2])
    context.set_line_width(frame_width)
    context.stroke()
  context.restore()
4.4. 点の出力
点の出力というよりかは、「円」の出力といったほうが正確でしょうか?
def draw_stars(context=None, stars=None, radius=1.0, center_pos=None, brightness=1.0, color_as_vector=None):
  context.save()

  for star in stars:
    context.set_source_rgb(color_as_vector[0],
                           color_as_vector[1],
                           color_as_vector[2])
    context.arc(star[0]*radius+center_pos[0],
                star[1]*radius+center_pos[1],
               np.math.sqrt(star[2]) *brightness,
                0, 2*math.pi)
    context.fill()

  context.restore()
4.5. フォントを用いた文字出力
OSにインストールしたフォントを利用することが可能です。事前に、context.select_font_faceにフォント名をセットしておきましょう。なくても多分描画します。
def draw_text(context=None, text=None, font_size=1, pos_as_vec=None, rotate=0, color_as_vec=None):
  context.save()
  context.set_font_size(font_size)
  context.move_to(pos_as_vec[0], pos_as_vec[1]) # 描画点へ移動
  context.rotate(2*math.pi*rotate/360) # 回転
  context.set_source_rgb(color_as_vec[0], color_as_vec[1], color_as_vec[2])
  context.show_text(text) # 文字の描画
  context.restore()

with cairo.PDFSurface("example.pdf", canvas_width, canvas_height) as surface:
  for face_num in range(12):
    context = cairo.Context(surface)
    context.scale(1, 1)
    context.select_font_face("Futura")

    draw_text(context=context,
              text='Face/{:0=2}'.format(face_num+1),
              font_size=100,
              pos_as_vec=np.array([inch(250),inch(170)]),
              rotate=-90,
              color_as_vec=color("#ffffff"))

    draw_text(context=context,
              text="Copyright(C) 2019 Space Science Research Club, National Institute of Technology, Kitakyushu College All rights reserved.",
              font_size=10,
              pos_as_vec=np.array([inch(40),inch(193)]),
              rotate=0,
              color_as_vec=color("#ffffff"))

    surface.show_page()
5. まとめ
最後に、今回作図した画像と前回Gnuplotで作図した画像を比較します。
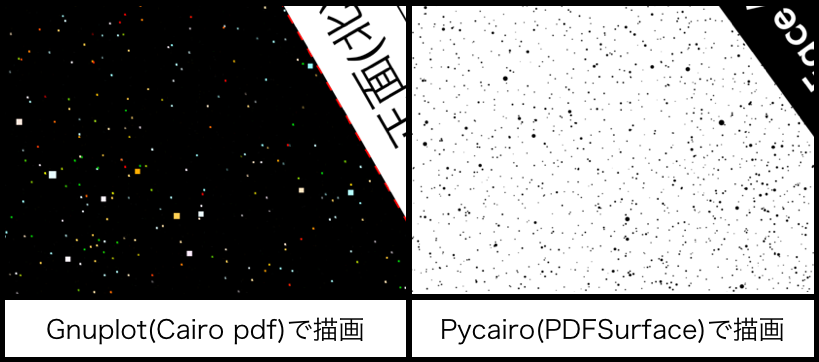
原盤の利用目的の違いにより、白黒反転が派生していますが、それを差し引いても、星を丸点でプロットしているだけでなく、各々の恒星の等級の違いを円の大きさとして丁寧に表示できていることが伺えます。このように、Pycairoは比較的低レベルなライブラリですが、だからこそ柔軟な図形表示の可能なライブラリであることがわかります。
ただ、Pycairoライブラリ自体が手続き的な記述によって描画するように作られているため、副作用的な描画部分と関数型言語的な意味での純粋な記述を分離できないのは、コードを書く上で多少ネックに感じました。
これは、技術的な課題であるように感じます。
ただ、pdfを出力することのできるPycairoを使うことで柔軟な図形ドキュメントを作成できることは、工作全般で応用できるのではないかと思います。
最後に、今回描画したPDFドキュメントのスクショと全ソースコードを貼っておきます。今回はGoole ColaboratoryをJupyter Notebookと共に利用したので、ソースもそれに合わせたものになります。
import cairo, math, csv, ast
from IPython.display import SVG, display
import numpy as np

# 文字列の描画
def draw_text(context=None, text=None, font_size=1, pos_as_vec=None, rotate=0, color_as_vec=None):
  context.save()
  context.set_font_size(font_size)
  context.move_to(pos_as_vec[0], pos_as_vec[1])
  context.rotate(2*math.pi*rotate/360)
  context.set_source_rgb(color_as_vec[0], color_as_vec[1], color_as_vec[2])
  context.show_text(text)
  context.restore()

# 背景色の描画
def draw_face(context, color_as_vector, width=100, height=100, margine=0):
  context.save()

  context.set_source_rgb(
      color_as_vector[0],
      color_as_vector[1],
      color_as_vector[2])
  context.translate(margine, margine)
  context.rectangle(0,0,width, height)
  context.fill()

  context.restore()

# 頂点ベクトルの描画
def draw_frame(
    context,
    verts_array,
    fill_color_as_rgb_vec,
    frame_color_as_rgb_vec,
    frame_width):

  if verts_array.shape[0] < 3:
    print("ERROR")
    exit()
  else:
    context.save()

    first_vert = verts_array[0]
    tail_vert_array = verts_array[1:]

    context.move_to(first_vert[0], first_vert[1])

    for vert in tail_vert_array:
      context.line_to(vert[0], vert[1])

    context.close_path()

    context.set_source_rgb(
        fill_color_as_rgb_vec[0],
        fill_color_as_rgb_vec[1],
        fill_color_as_rgb_vec[2])
    context.fill_preserve()

    context.set_source_rgb(
        frame_color_as_rgb_vec[0],
        frame_color_as_rgb_vec[1],
        frame_color_as_rgb_vec[2]
    )
    context.set_line_width(frame_width)
    context.stroke()

    context.restore()

# 星の描画
def draw_stars(context=None, stars=None, radius=1.0, center_pos=None, brightness=1.0, color_as_vector=None):
  context.save()

  for star in stars:
    context.set_source_rgb(color_as_vector[0],
                           color_as_vector[1],
                           color_as_vector[2])
    context.arc(star[0]*radius+center_pos[0],
                star[1]*radius+center_pos[1],
               np.math.sqrt(star[2]) *brightness,
                0, 2*math.pi)
    context.fill()

  context.restore()

# 正N角形の頂点ベクトルの生成
def gen_regular_polygon(center_pos=None, n=3, radius=1, rotate=0):
  theta = 2 * math.pi / n
  rot_rad = 2 * math.pi * rotate / 360.0

  verts = np.array([[[math.cos(i*theta) * radius + center_pos[0]],
                     [math.sin(i*theta) * radius + center_pos[1]],
                     [1]]
                    for i in range(n)])

  rcos = math.cos(rot_rad)
  rsin = math.sin(rot_rad)
  r31 = -center_pos[0]*rcos + center_pos[1]*rsin + center_pos[0]
  r32 = -center_pos[0]*rsin - center_pos[1]*rcos + center_pos[1]

  rot_vec = np.array([[rcos, -rsin, r31],
                      [rsin, rcos, r32],
                      [0, 0, 1]])

  verts = np.concatenate([[np.dot(rot_vec, vert)] for vert in verts])

  verts = np.apply_along_axis(lambda x: np.array([x[0], x[1]]), arr=verts, axis=1).reshape([n, 2])

  return verts

# メートル・インチの変換
def inch(meter):
  return 0.0393701 * meter * 72.0

# agb文字列のベクター化
def color(color_string):
  return np.array([int(color_string[1:3], 16), int(color_string[3:5], 16), int(color_string[5:7], 16)])

# のりしろの描画
def draw_margines(context=None, verts=None, center_pos=None, edge_size=1, line_color_as_vec=None, frame_width=1, margin_face_num_list=None):
  vert_multi = verts.repeat(2, axis=0)
  vert_pairs = np.roll(vert_multi, -2).reshape([verts.shape[0], 2, verts.shape[1]])

  midpoints = np.apply_along_axis(func1d=lambda x: np.sum(a=x, axis=0)/2, axis=1, arr=vert_pairs)
  orth_vecs = midpoints - center_pos
  euclid_dists = np.mean(np.apply_along_axis(func1d=lambda x: np.linalg.norm(x), axis=1, arr=orth_vecs))

  normals = orth_vecs / euclid_dists
  normals_pairs = normals.repeat(2, axis=0).reshape([normals.shape[0], 2, 2])

  edges_arr = edge_size * normals_pairs + vert_pairs

  edges_arr = np.array([[vert_pairs[x,0], edges_arr[x,0], edges_arr[x,1], vert_pairs[x,1]] for x in range(edges_arr.shape[0])])

  context.save()
  for edges in edges_arr:
    first_edge = edges[0]
    context.move_to(first_edge[0], first_edge[1])
    for edge in edges[1:]:
      context.line_to(edge[0], edge[1])
    context.set_source_rgb(line_color_as_vec[0],line_color_as_vec[1],line_color_as_vec[2])
    context.set_line_width(frame_width)
    context.stroke()
  context.restore()

  inner_product = np.apply_along_axis(lambda x: np.dot(x, np.array([0,1])), axis=1, arr=normals)
  thetas = np.apply_along_axis(lambda x: np.arccos(x)/(2*np.pi)*360, axis=0, arr=inner_product)
  sign = np.apply_along_axis(lambda x: -1 if x[0]>0 else 1, axis=1, arr=normals)
  signed_thetas = sign * thetas
  print(signed_thetas)

  context.save()
  for index, theta in enumerate(signed_thetas):
    draw_text(context=context,
              text='Face/{:0=2}'.format(margin_face_num_list[index]),
              font_size=15,
              pos_as_vec=orth_vecs[index] + center_pos + normals[index] * edge_size*0.7,
              rotate=theta,
              color_as_vec=color("#ffffff"))
  context.restore()

# 星図表の切り出し
def gen_star_catalogue(file_name=None, face_num=0):
  face_vector = [[] for _ in range(face_num)]

  with open(file_name, mode='r') as csv_file:
    for line in csv.reader(csv_file, delimiter=' '):
      face_vector[int(line[0])].append([ast.literal_eval(line[1]),
                                        ast.literal_eval(line[2]),
                                        ast.literal_eval(line[3])])

  for face in range(face_num):
      face_vector[face] = np.array(face_vector[face])

  return face_vector

# 糊代のインデックス割当
margin_index = [[6, 5, 4, 3, 2],   [7, 6, 1, 3, 8],   [8, 2, 1, 4, 9],
                [9, 3, 1, 5, 10],  [10, 4, 1, 6, 11], [11, 5, 1, 2, 7],
                [2, 8, 12, 11, 6], [3, 9, 12, 7, 2],  [4, 10, 12, 8, 3],
                [5, 11, 12, 9, 4], [6, 7, 12, 10, 5], [10, 11, 7, 8, 9]]

# ハイパーパラメータ
normal_scale = 100
canvas_height = inch(210)
canvas_width  = inch(297)
face_center_position = np.array([inch(125), inch(105)])
face_radius = inch(74.85727113)
face_mid_dist = inch(77.15727113)
face_rotate_list = [0]+[180]*10+[0]

# 製図表データ配列
star_catalogue = gen_star_catalogue(file_name="./starout.txt", face_num=12)

# PDFファイルの出力
with cairo.PDFSurface("example.pdf", canvas_width, canvas_height) as surface:
  for face_num in range(12):
    context = cairo.Context(surface)
    context.scale(1, 1)
    context.select_font_face("Futura")

    draw_face(context,
              color_as_vector=color('#000000'),
              width=canvas_width-inch(30),
              height=canvas_height-inch(30),
              margine=inch(15))

    verts = gen_regular_polygon(
        center_pos=face_center_position,
        n=5,
        radius=face_radius,
        rotate=face_rotate_list[face_num])

    draw_frame(context=context,
               verts_array=verts,
               fill_color_as_rgb_vec=color('#ffffff'),
               frame_color_as_rgb_vec=color('#000000'),
               frame_width=0.02)

    draw_margines(context=context,
                  verts=verts,
                  center_pos=face_center_position,
                  edge_size=inch(10),
                  line_color_as_vec=color("#ff0000"),
                  frame_width=1,
                  margin_face_num_list=margin_index[face_num])

    stars = star_catalogue[face_num]

    draw_stars(context=context,
               stars=stars,
               radius=face_mid_dist,
               center_pos=face_center_position,
               brightness=0.5,
               color_as_vector=color('#000000'))

    draw_text(context=context,
              text='Face/{:0=2}'.format(face_num+1),
              font_size=100,
              pos_as_vec=np.array([inch(250),inch(170)]),
              rotate=-90,
              color_as_vec=color("#ffffff"))

    draw_text(context=context,
              text="Copyright(C) 2019 Space Science Research Club, National Institute of Technology, Kitakyushu College All rights reserved.",
              font_size=10,
              pos_as_vec=np.array([inch(40),inch(193)]),
              rotate=0,
              color_as_vec=color("#ffffff"))


    surface.show_page()
追記
プラネタリウムの原盤を印刷する際、ほとんど化石に等しいOHPシートを利用するのですが、家庭や学校にあるプリンターではシートが詰まったり、そもそも印刷濃度が(設定で一番濃くしたとしても、)とても薄いということが多々あります。
こういった状況に陥った場合に、キンコーズなどのOHPシートの印刷に対応してくれる印刷屋さんに行くのが手っ取り早く、ここだと(少なくとも地元の店では)OHPシートに濃く印刷することができました。
ただし、OHPシートの印刷では、そもそも印刷屋さんが白黒印刷しか対応してなかったり、できたとしても色が超薄かったりして、せっかくの色情報も生かされませんので、その点は注意すべきでしょう。
それから、OHPシートに限らず印刷した瞬間はインクでシートや手が汚れるといったことも考えられるので、上図のように周辺に印刷しないゾーンを設けておくことが得策です。