引っかかったところ
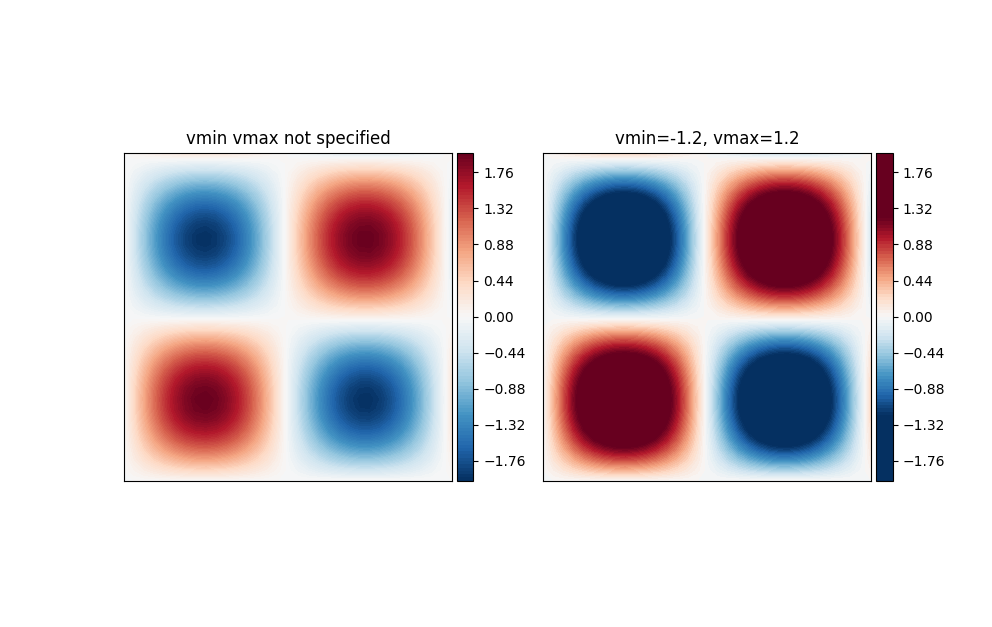
matplotlibのcontourf使用時にset_clim(vmin, vmax)で上限と下限を設定するとカラーバーがサチる.
例によってテイラー・グリーン渦の渦度を可視化してみる.
$$
\begin{aligned}
\omega &= 2 \sin x \sin y.
\end{aligned}
$$
import numpy as np
from numpy import pi, sin
import matplotlib.pyplot as plt
from mpl_toolkits.axes_grid1 import make_axes_locatable, axes_size

# Parameters
N = 100
lvls = 100
xmax = 2*pi
ymax = 2*pi
vmin = -1.2
vmax = 1.2

# Taylor-Green Vortices
x = np.linspace(0, xmax, N)
y = np.linspace(0, ymax, N)
X, Y = np.meshgrid(x, y)
omega = 2*sin(X)*sin(Y)

# PLOT
fig, ax = plt.subplots(1,2)
plt1 = ax[0].contourf(X, Y, omega, 100, cmap='RdBu_r')
fig.colorbar(plt1, ax=ax[0])

plt2 = ax[1].contourf(X, Y, omega, 100, cmap='RdBu_r')
plt2.set_clim(vmin=vmin, vmax=vmax)
fig.colorbar(plt2, ax=ax[1])
plt.show()
解決策
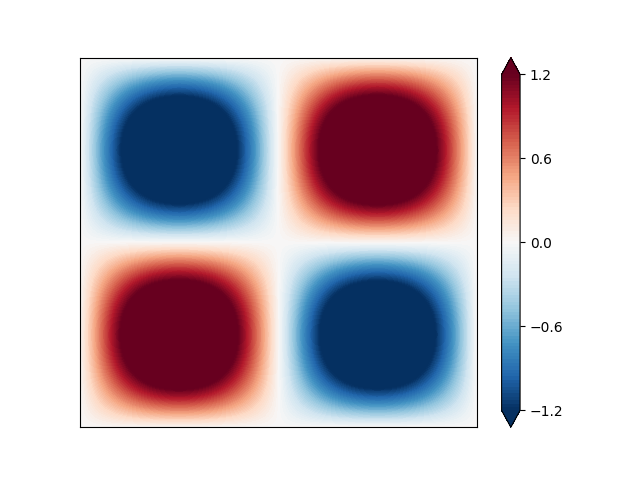
levels = (vmin, vmax, 100)で上限下限を指定してextednd = 'both'をオプションに加えるだけだった...
plt.contourf(X, Y, omega, np.linspace(vmin, vmax, 100), cmap='RdBu_r', extend='both')
plt.colorbar(ticks=np.linspace(vmin, vmax, 5))
plt.xticks([])
plt.yticks([])
plt.show()
参考にしたサイト

