Pythonでグレースケール画像のヒストグラムを表示する方法。
PIL(Pillow), numpy, matplotlibはインストール済みの前提。
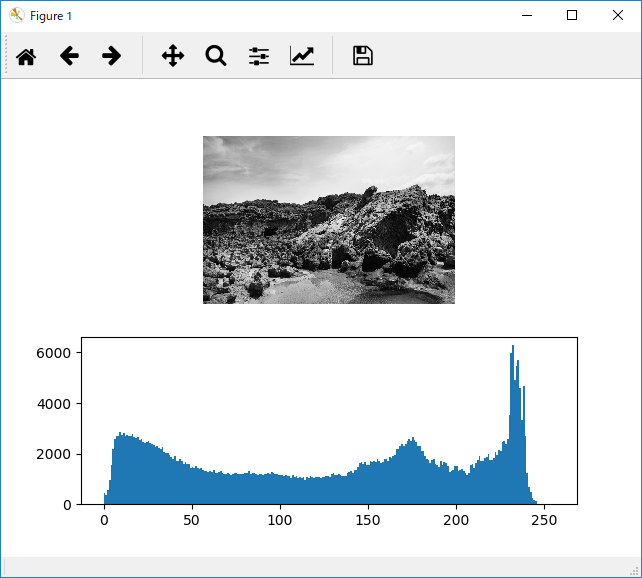
実際に表示させた結果
単にヒストグラムだけ表示すると分かりづらいので、ヒストグラムの上に画像も表示させる。

コード
# -*- coding:utf-8 -*-

from PIL import Image
import numpy as np
import matplotlib.pyplot as plt

# 画像の読み込み & グレースケールに変換
img = Image.open('適当な画像ファイル').convert('L')

# 上段の画像の表示設定
plt.subplot(2, 1, 1) # 引数はそれぞれ、全体の行数、全体の列数、設定対象のIndex
a = np.array(img)
plt.imshow(a)
plt.gray()
plt.axis('off')

# 下段のヒストグラムの設定
plt.subplot(2, 1, 2)
plt.hist(a.flatten(), bins=np.arange(256 + 1)) #階級の幅を1としてヒストグラムを出す。

# 図表の表示
plt.show()
plt.gray()はグレースケール画像を表示する指定。これをしておかないと元の画像がグレースケールでも色が付く。
plt.histsのbinsの指定で+1をしているのは、ヒストグラムの最後の階級の区間を[255, 256]とするため。+1しないと最後の階級の区間が[254, 255]となり、254と255の両方の頻度が集計されてしまう。
ヒストグラムだけ欲しい場合
numpyの関数histogramを使う(matplotlibのhist関数も内部ではこれを使っている)。
img = Image.open('適当な画像ファイル')).convert('L')
histogram, _ = np.histogram(np.array(img).flatten(), bins=np.arange(256 + 1))