初投稿です。お手柔らかにお願いします!
今日は、kaggleのタイタニックでとあるkernelsを読んでいたところ、
Seabornというライブラリを使った、相関係数行列の作成があったので詳しく見ていきたいと思います。
参考:
https://www.kaggle.com/arthurtok/introduction-to-ensembling-stacking-in-python
環境:kaggleのkernel(仮想環境)
相関係数行列、書けると何が嬉しいの?
機械学習において余計なパラメータは計算リソースが増える・過学習の可能性が増えるので、
減らしたいものです。
相関が強い二つパラメータは、片方のパラメータで説明できてしまうので、
必要が薄いのです。
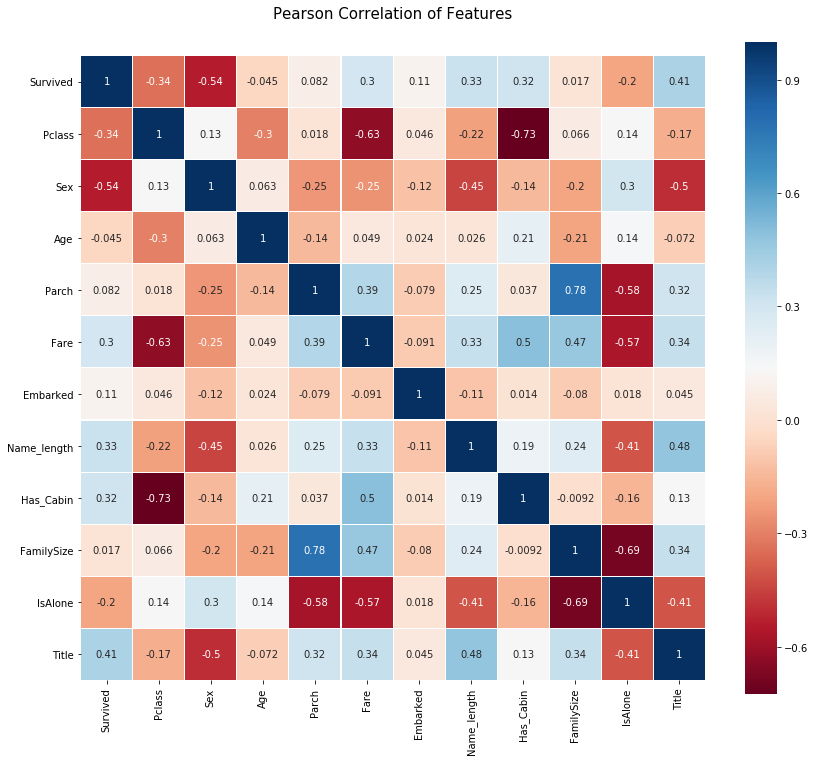
相関係数行列を表示すると、パラメータ毎の相関が一発でわかるので、
パラメータ選定の助けになります。
seabornとは?
seabornとは、pythonのライブラリの一つで、
matplotlibのラッパー的なやつです。
matplotlibより、簡単に綺麗にグラフの描画が出来ます!
細かい設定はmatplotlibのが出来るけどざっくり書くには見やすく、簡単にかけてお勧めです。
参考:
https://myenigma.hatenablog.com/entry/2015/10/09/223629
コードとグラフの出力結果
入力(train)↓
trainはpd.Dataframe型に格納されており、全て数値になるように前処理しています。

import seaborn as sns
import matplotlib.pyplot as plt

colormap = plt.cm.RdBu
plt.figure(figsize=(14,12))
plt.title('Pearson Correlation of Features', y=1.05, size=15)
sns.heatmap(train.astype(float).corr(),linewidths=0.1,vmax=1.0,
            square=True, cmap=colormap, linecolor='white', annot=True)
出力↓
詳しい説明
細かく見ていきましょう。
colormap = plt.cm.RdBu
plt.cmでカラーマップを呼び出しています。
RdBuとはどんな色を使うかの指定です。
今回はRed⇔Blueのカラーマップなのでこのように指定しています。
他の指定をしたい場合は下記のサイトにまとまっています。
参考:
https://matplotlib.org/examples/color/colormaps_reference.html
plt.figure(figsize=(14,12))
plt.title('Pearson Correlation of Features', y=1.05, size=15)
描画するサイズとタイトルを設定しています。
これはmatplotlibの設定ですね!
sns.heatmap(train.astype(float).corr(),linewidths=0.1,vmax=1.0,
            square=True, cmap=colormap, linecolor='white', annot=True)
この一文でheatmapが書けてしまいます!
各引数を見ていきましょう。
train.astype(float).corr()
これによって、各列の相関係数が計算されています。
DataFrame型のメソッドの一つです。
参考:https://pandas.pydata.org/pandas-docs/stable/generated/pandas.DataFrame.corr.html
linewidths=0.1
格子線の太さを指定しています
vmax=1.0
相関係数の最大値を指定してます。右側のバーの一番上の値と思ってOKです。
square=True
正方形で出力されます
cmap=colormap
色の指定です。matplotlbのカラーマップを使用します。
linecolor='white'
格子線の色指定です。
annot=True
各要素に値を表示するかどうかを指定できます。
終わり
こんなに簡単に書けるなんて驚きですね!
kaggleのkernelsは英語でちょっと抵抗があるかと思いますが、
強いデータサイエンティストの華麗なPython捌きを無料で見ることが出来るため、
非常にお勧めです!
初投稿ゆえ、見づらい部分などありましたらご指摘いただけたら幸いです!
