現在Angulrで作成しているアプリケーション内でグラフを作成したく、swimlane/ngx-chartsというライブラリを使ってみました。結論、かっこいいグラフが簡単に作れてめっちゃ便利でした・・・
環境
- Angular:12.0.5
- @swimlane/ngx-charts:20.0.1
インストール
まずはインストール。
npm i @swimlane/ngx-charts --save
早速エラー。
Error: node_modules/@swimlane/ngx-charts/lib/box-chart/box-chart.component.d.ts:5:40 - error TS7016: Could not find a declaration file for module 'd3-scale'. '/node_modules/d3-scale/dist/d3-scale.js' implicitly has an 'any' type.
  Try `npm i --save-dev @types/d3-scale` if it exists or add a new declaration (.d.ts) file containing `declare module 'd3-scale';`

5 import { ScaleLinear, ScaleBand } from 'd3-scale';
ググると
npm install @types/d3 --save-dev
すると良いよ〜って書いてあるので実行してみるとエラーなくなった!![]()
モジュール登録
app.module.tsに追加します
import { NgxChartsModule } from '@swimlane/ngx-charts';

@NgModule({
  imports: [
    CommonModule,
    FormsModule,
    NgxChartsModule,
  ],
)}
実際に使ってみる
ドキュメントはこちら
デモサイトはこちら
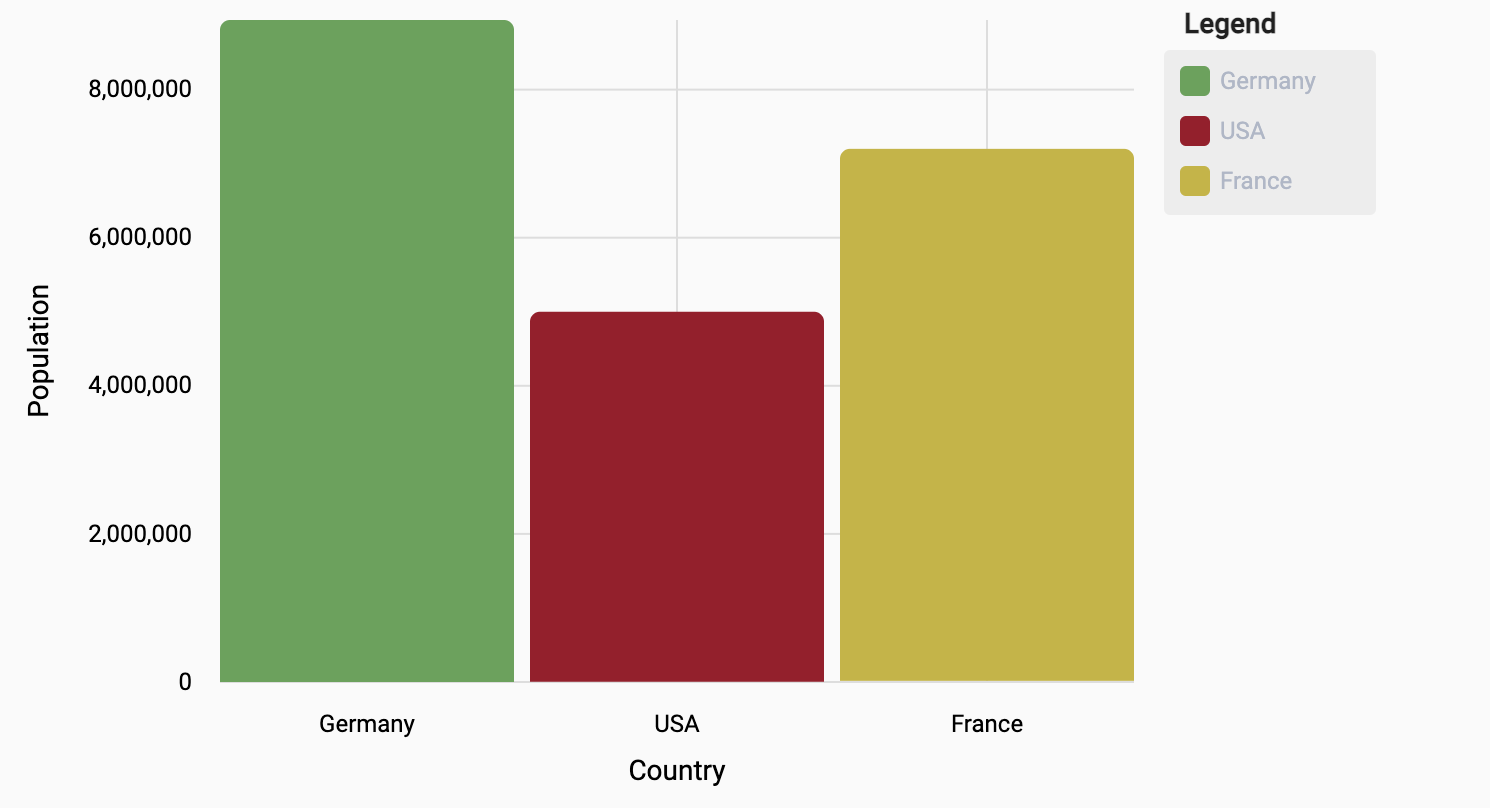
とりあえず、縦の棒のグラフを作ってみます。StackBlitzからコピペ。
export class AppComponent {
  single: any[] = [
    {
      "name": "Germany",
      "value": 8940000
    },
    {
      "name": "USA",
      "value": 5000000
    },
    {
      "name": "France",
      "value": 7200000
    }
  ];

  view: any[] = [700, 400];

  // options
  showXAxis = true;
  showYAxis = true;
  gradient = false;
  showLegend = true;
  showXAxisLabel = true;
  xAxisLabel = 'Country';
  showYAxisLabel = true;
  yAxisLabel = 'Population';

  colorScheme = {
    domain: ['#5AA454', '#A10A28', '#C7B42C', '#AAAAAA']
  };

  constructor() {
  }

}
<ngx-charts-bar-vertical
  [view]="view"
  [scheme]="colorScheme"
  [results]="single"
  [gradient]="gradient"
  [xAxis]="showXAxis"
  [yAxis]="showYAxis"
  [legend]="showLegend"
  [showXAxisLabel]="showXAxisLabel"
  [showYAxisLabel]="showYAxisLabel"
  [xAxisLabel]="xAxisLabel"
  [yAxisLabel]="yAxisLabel"
>
</ngx-charts-bar-vertical>
すると型違いによるコンパイルエラーがいくつか。
Error: app.component.html:2:4 - error TS2322: Type 'any[]' is not assignable to type '[number, number]'.
  Target requires 2 element(s) but source may have fewer.

2   [view]="view"
言われた通りに書き直します。
view: [number, number] = [700, 400];
エラー消えました!![]()
any[]でも別に間違ってはなくね?(というかデモのコードでそう書かれてるのに)と思いましたが・・・
ソースコードでviewはnumberのarray(number[])ではなく2つのnumberのタプル([number, number])で定義されているからエラーになると・・・へえ〜〜〜
続いてもう一つ出ているエラー。
Error: app.component.html:3:4 - error TS2322: Type '{ domain: string[]; }' is not assignable to type 'string | Color'.
  Type '{ domain: string[]; }' is missing the following properties from type 'Color': name, selectable, group

3   [scheme]="colorScheme"
とりあえず、colorSchemeの型を指定してみます。
import { Color } from '@swimlane/ngx-charts';

colorScheme: string | Color = {
  domain: ['#5AA454', '#A10A28', '#C7B42C', '#AAAAAA']
};
すると、name、selectable、groupのプロパティが足りないと・・・
Error: app.component.ts:49:3 - error TS2322: Type '{ domain: string[]; }' is not assignable to type 'string | Color'.
  Type '{ domain: string[]; }' is missing the following properties from type 'Color': name, selectable, group

49   colorScheme: string | Color = {
Colorの定義を見てみると、うん。確かに。
export interface Color {
    name: string;
    selectable: boolean;
    group: ScaleType;
    domain: string[];
}
ググると、Colorはこう定義するべきじゃね?と。
export interface Color {
    name?: string;
    selectable?: boolean;
    group?: ScaleType;
    domain: string[];
}
言われている通り定義し直したらエラー消えました。![]()
※こういうふうに直接定義し直しちゃって良いのかは正直分からないです・・・
実際の画面
こんな感じで棒グラフが表示されました!![]()
試しに2カ国増やしてみます。(ついでにnameとvalueの""をはずしてみたけど特に変化はなかった。)
single: any[] = [
    {
      name: "Germany",
      value: 8940000
    },
    {
      name: "USA",
      value: 5000000
    },
    {
      name: "France",
      value: 7200000
    },
    {
      name: "Japan",
      value: 7200000
    },
    {
      name: "China",
      value: 7200000
    }
  ];

colorScheme: string | Color = {
  domain: ['#5AA454', '#A10A28', '#C7B42C', '#AAAAAA']
};
colorScheme.domeinで指定した色が順に使われるんですね〜
エラー解決履歴
Legendをグラフの下に表示させたい
<ngx-charts-bar-vertical
 [legendPosition]="legendPosition" //追加
>
</ngx-charts-bar-vertical>
export class AppComponent implements OnInit {

  legendPosition: string = 'below'; //追加

}
すると何故かコンパイルエラー。
Error: app.component.html:13:4 - error TS2322: Type 'string' is not assignable to type 'LegendPosition'.

13   [legendPosition]="legendPosition"
・・・?![]() ググりました
ググりました
このコミットでLegendPositionの(ための)typing'sがenumに変わったと。
import { LegendPosition } from '@swimlane/ngx-charts';  //追加

export class AppComponent implements OnInit {

  legendPosition: LegendPosition = LegendPosition.Below; //変更

}
このように変更してエラー消えました。
option
デモサイトをポチポチしてたらどのoptionを変えると何が起きるのかは大体わかるのですが、便利なoptionがあったら追記していきたいと思います!