plotlyの勉強中。メソッドがやたらあって検索すると色々なやり方がヒットして戸惑う……。
plotly で3行・3列のサブプロットを取る。そして、1行1列目、2行2列目、3行3列目に折れ線グラフを追加したいとする。以下の3つはすべて同じ結果。
from plotly.subplots import make_subplots
fig = make_subplots(rows=3, cols=3)
#「折れ線グラフを追加する」メソッド。どのサブプロットに追加するかをrow,colで指定する。
#何も考えずに追加するならこれが一番簡単。
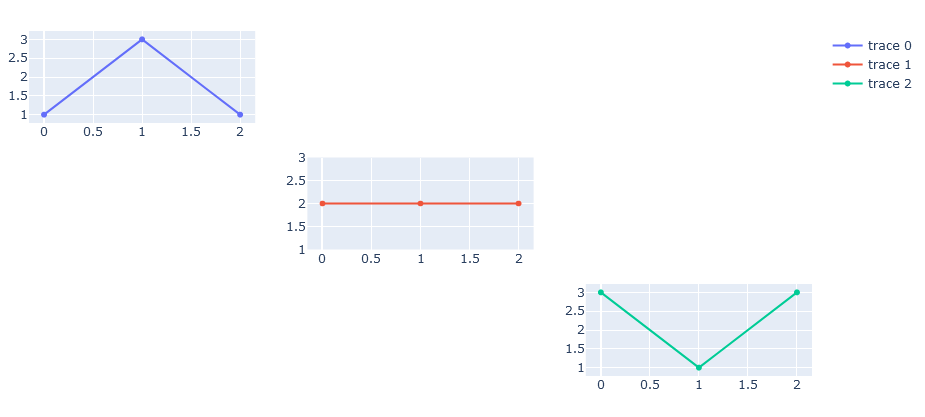
fig.add_scatter(y=[1,3,1], row=1, col=1)
fig.add_scatter(y=[2,2,2], row=2, col=2)
fig.add_scatter(y=[3,1,3], row=3, col=3)
fig.show()
from plotly.subplots import make_subplots

fig = make_subplots(rows=3, cols=3)

#「グラフ」を追加するメソッドに、折れ線グラフを渡す。
fig.add_trace(go.Scatter(y=[1,3,1]), row=1, col=1)
fig.add_trace(go.Scatter(y=[2,2,2]), row=2, col=2)
fig.add_trace(go.Scatter(y=[3,1,3]), row=3, col=3)
fig.show()
from plotly.subplots import make_subplots

fig = make_subplots(rows=3, cols=3)

#複数グラフの追加に対応したメソッド。
#追加するグラフをリストで渡し、どのサブプロットに追加するかをrows,colsで指定する。
#グラフのリスト順とrows, colsのリスト順が対応するように注意すること。
fig.add_traces([
    go.Scatter(y=[1,3,1]),
    go.Scatter(y=[1,1,1]),
    go.Scatter(y=[3,1,3])
],rows=[1,2,3], cols=[1,2,3])
fig.show()
print_grid() を使うことでサブプロットのグリッドを確認できる。
fig.print_grid()
This is the format of your plot grid:
[ (1,1) x,y ] [ (1,2) x2,y2 ] [ (1,3) x3,y3 ]
[ (2,1) x4,y4 ] [ (2,2) x5,y5 ] [ (2,3) x6,y6 ]
[ (3,1) x7,y7 ] [ (3,2) x8,y8 ] [ (3,3) x9,y9 ]