1. 趣旨
ほぼ趣味。
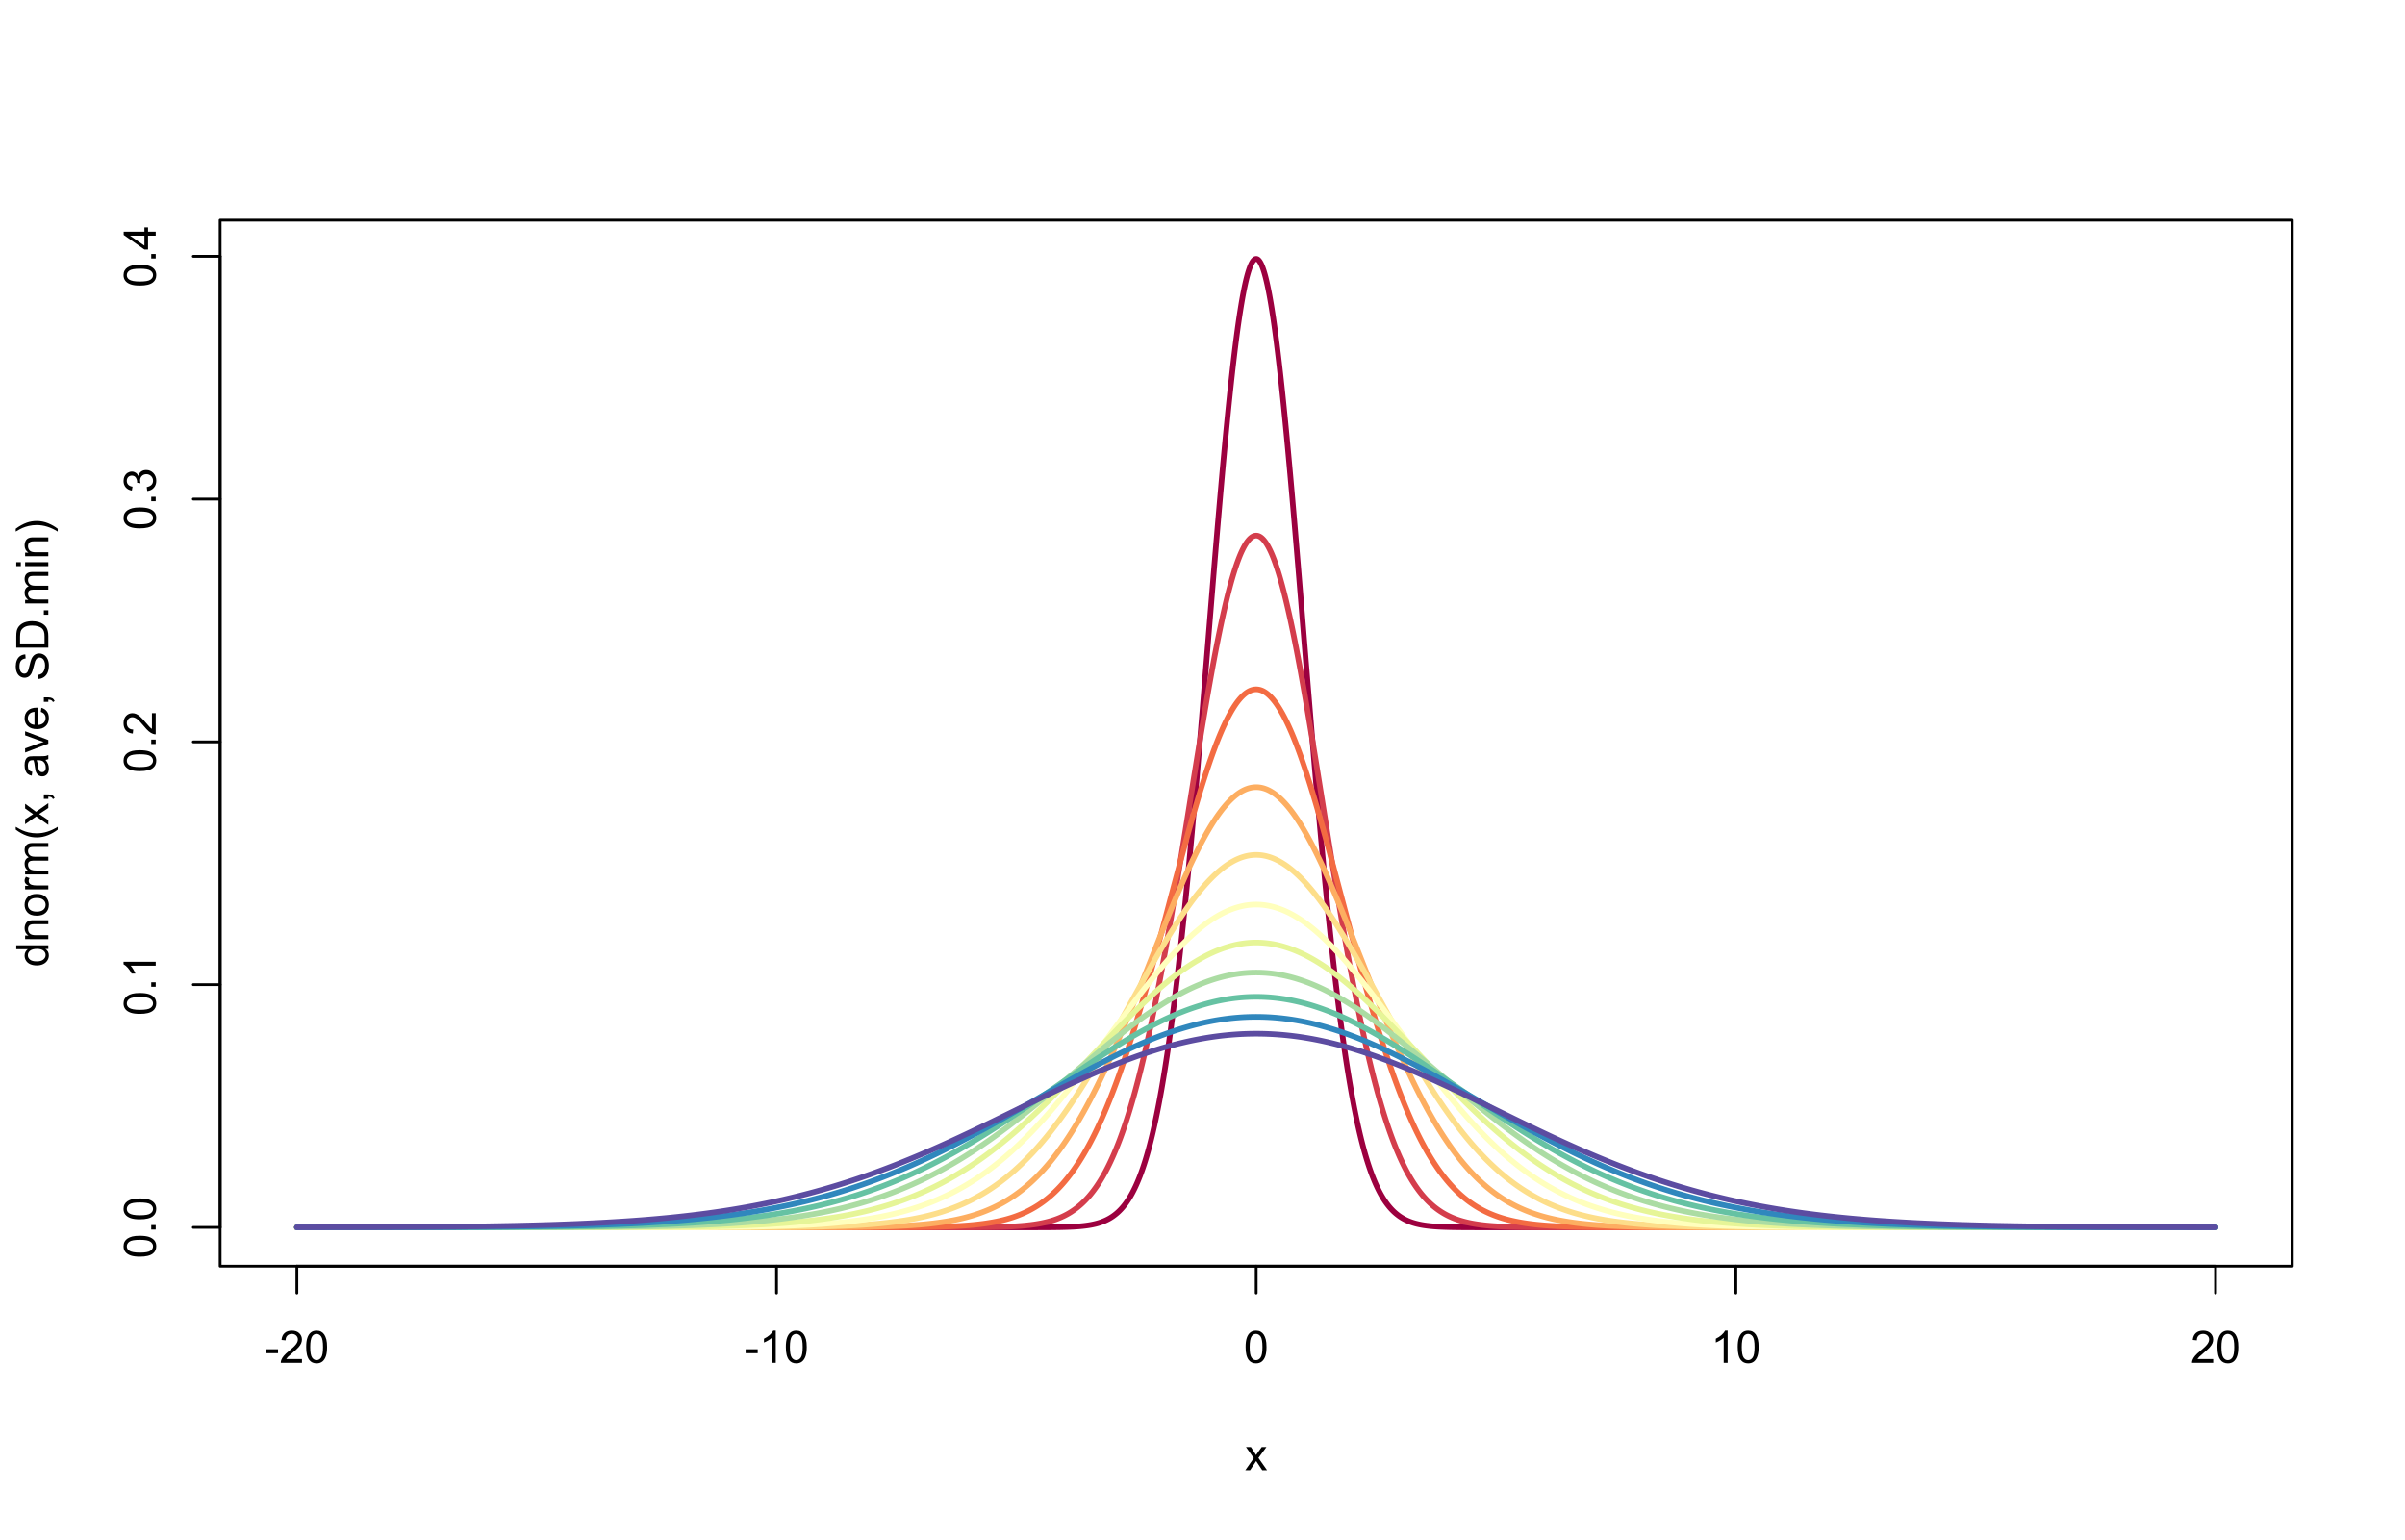
改めて「正規分布とは」ということを考えるにあたって、色んな標準偏差の正規分布を図に描いてみるのも良かろう、ということで。
2. 実装
{RColorBrewer}というパッケージが必要です。
nd <- function(SD = c(1), left, right, ave = 0, add = F, pallet.name = "Spectral"){
  library(RColorBrewer)
  if (missing(left)){
    left <- ave - max(SD) * 4
  }
  if (missing(right)) {
    right <- ave + max(SD) * 4
  }
  SD.length.before <- length(SD)
  SD <- unique(sort(SD))
  if (length(SD) < SD.length.before) {
    warning("SDのうち、重複する要素を削除しました。")
  }
  if (length(SD) > 11) {
    warning("カラーパレットの都合上、SDの要素数は最大で11です。超過分のうちより大きい要素を削除しました。")
    SD <- SD[1:11]
  }
  SD.length <- length(SD)
  SD.min <- SD[which.min(SD)]
  SD.min.max <- dnorm(ave, ave, SD.min)
  SD.min.else <- SD[-1]
  if (SD.length < 3) {
    SD.length <- 3
  }
  pallet <- brewer.pal(SD.length, pallet.name)
  col.number <- 2
  curve(dnorm(x, ave, SD.min), left, right, add = add, col = pallet[1], lwd = 2, n = 30000)
  if (add) {
  } else {
    plot.window(xlim = c(left, right), ylim = c(0, SD.min.max))
  }
  for (SD.data in SD.min.else) {
    curve(dnorm(x, ave, SD.data), left, right, add = T, col = pallet[col.number], lwd = 2, n = 30000)
    col.number <- col.number + 1
  }
}
3. 結果
平均0, 標準偏差が1~5(0.4刻み)の正規分布をプロットしてみました。
> nd(SD = seq(1, 5, by = 0.4))
4. おわりに
きれいじゃん(小並感)
Enjoy!
おしまい。
