Objective
I would like to give a try to create something using Python rather than preparing in advance to know deeply about it.
Things I am doing are...
- obtaining historical data from Stock Market
- making data visualization (plot)
1: geting stock market data
There are several sources you can get historical daily price-volume stock market data from.
I use stooq(https://stooq.com/) this time.
(Yahoo is no longer being used since Pandas is no longer working with Yahoo Finance.)
installing pandas_reader module via pip
!pip install pandas_datareader
from pandas_datareader import data
import pandas as pd
import matplotlib.pyplot as plt
%matplotlib inline
S&P500 is used in this prac.
The ticker is "SPX" and 'stooq' is used for the data.
start = '2006-03-15'
end = '2023-01-21'

df = data.DataReader('^SPX', 'stooq', start, end)
df.head(10)
Running the script above should return the following in your console.
	Open	High	Low	Close	Volume
Date
2023-01-20	3909.04	3972.96	3897.86	3972.61	2.699404e+09
2023-01-19	3911.84	3922.94	3885.54	3898.85	2.550553e+09
2023-01-18	4002.25	4014.16	3926.59	3928.86	2.644401e+09
2023-01-17	3999.28	4015.39	3984.57	3990.97	2.561165e+09
2023-01-13	3960.60	4003.95	3947.67	3999.09	2.305645e+09
2023-01-12	3977.57	3997.76	3937.56	3983.17	2.468086e+09
2023-01-11	3932.35	3970.07	3928.54	3969.61	2.353913e+09
2023-01-10	3888.57	3919.83	3877.29	3919.25	2.140006e+09
2023-01-09	3910.82	3950.57	3890.42	3892.09	2.498159e+09
2023-01-06	3823.37	3906.19	3809.56	3895.08	2.462500e+09
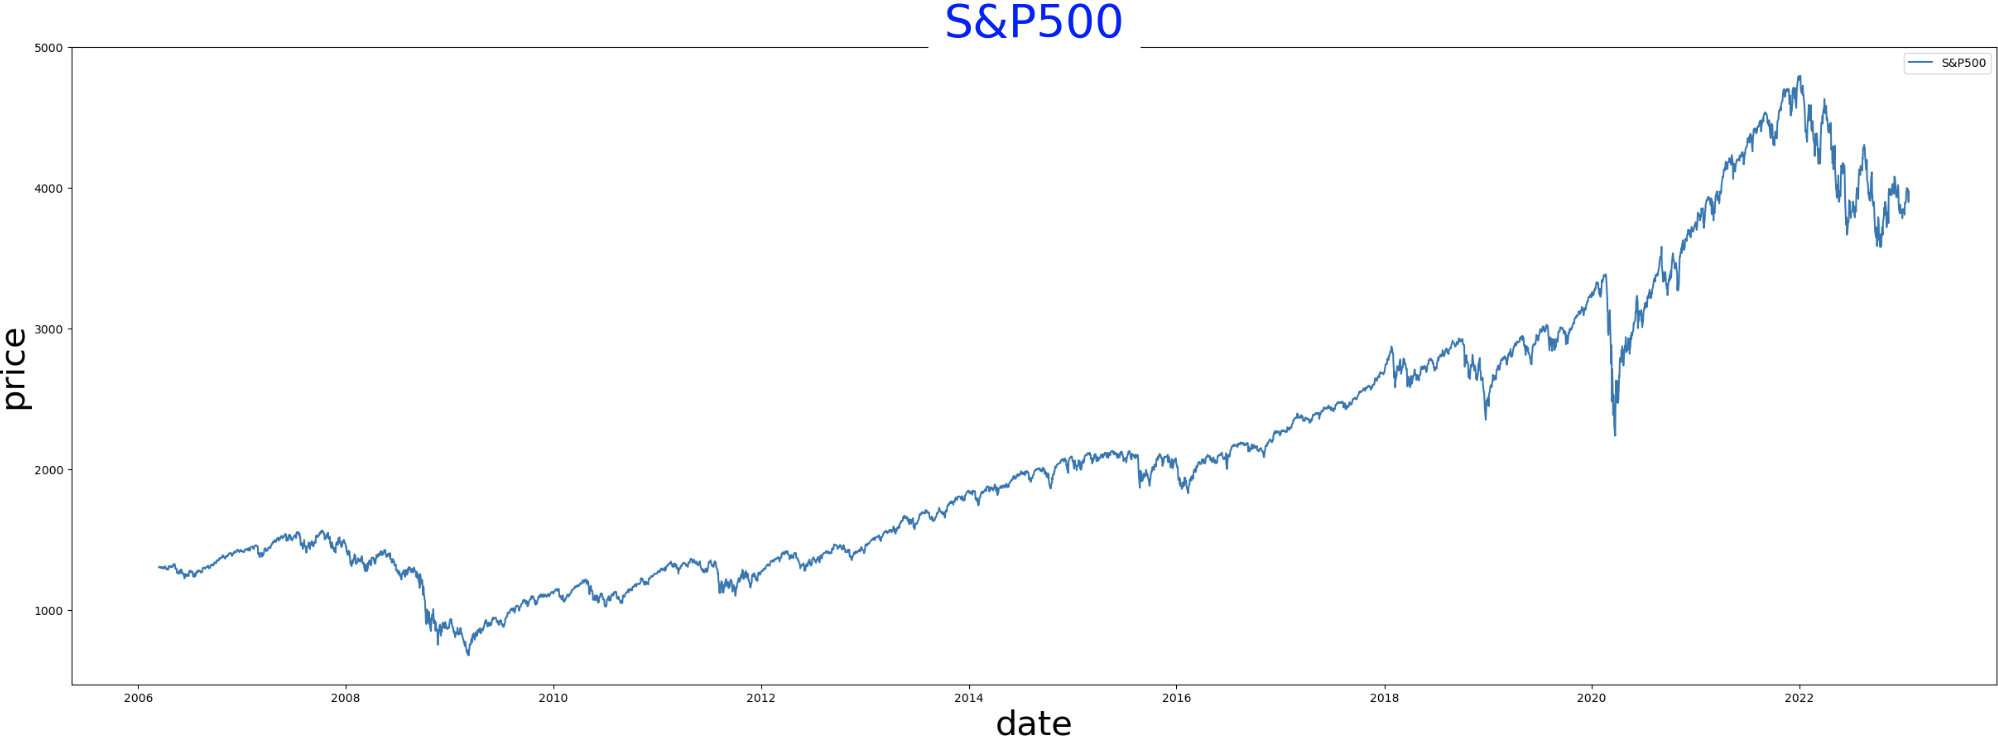
In order to make visualize the table data above, you can use the matplotlib library and plot method as shown below.
date = df.index
price=df['Close']
plt.figure(figsize=(30, 10))
plt.plot(date,price,label='S&P500')
plt.title('S&P500',color='blue',backgroundcolor='white',size=40, loc='center')
plt.xlabel('date', color='black', size=30)
plt.ylabel('price', color='black', size=30)
plt.legend()
Let me improve the plot by adding 2 kinda moving averages (50&200days) and giving approproate labels.
#移動平均線を算出する
span01=50
span02=200

df['sma01'] = price.rolling(window=span01).mean()
df['sma02'] = price.rolling(window=span02).mean()
pd.set_option('display.max_rows', None)
df.head(100)
plt.figure(figsize=(30, 10))
plt.plot(date,price,label='S&P500')
plt.plot(date,df['sma01'],label='SMA(50)')
plt.plot(date,df['sma02'],label='SMA(200)')

plt.title('S&P500',color='blue',backgroundcolor='white',size=40, loc='center')
plt.xlabel('date', color='black', size=30)
plt.ylabel('price', color='black', size=30)
plt.legend()

a lot better but it seems something is missing...
That is ,,,, trading volume !!
Let's add that into the plot.
plt.figure(figsize=(30, 15))
plt.bar(date,df['Volume'],label='Volume',color='grey')

plt.legend()

In Matplotlib, we can draw multiple graphs in a single.
I use Subplot() function.
plt.figure(figsize=(30, 15))
plt.subplot(2,1,1)

plt.plot(date,price,label='S&P500')
plt.plot(date,df['sma01'],label='SMA(50)')
plt.plot(date,df['sma02'],label='SMA(200)')

plt.subplot(2,1,2)
plt.bar(date,df['Volume'],label='Volume',color='grey')

plt.legend()

I'm done for today.
I know this is just the beginning but I feel Python is much easier compared to Java that was my frist programming language.
p.s.
I wanted to create an another plot for an individual stock.
I choose JP Morgan Chase coz their Q4 earnings beat the consensus estimate.
 #JPMorgan Q4
df = data.DataReader('JPM.US', 'stooq')
df = df.sort_index()
df = df[(df.index>='2020-01-01 00:00:00') & (df.index<='2023-01-23 00:00:00')]
date=df.index
price=df['Close']

span01=50
span02=200

df['sma01'] = price.rolling(window=span01).mean()
df['sma02'] = price.rolling(window=span02).mean()

plt.figure(figsize=(30, 15))
plt.subplot(2,1,1)

plt.plot(date,price,label='JP Morgan')
plt.plot(date,df['sma01'],label='SMA(50)')
plt.plot(date,df['sma02'],label='SMA(200)')

plt.subplot(2,1,2)
plt.bar(date,df['Volume'],label='Volume',color='grey')

plt.legend()

The code should be modified using variables and functions.
I leave the task for next time!
Appendix (adding Variables and Functions)
It's kinda troublesome to write all the code above every time I look up each stock.
Therefore, functions are used.
Defining a function using def
# 関数定義

def Individual_Stock(start,end,Company_Ticker):
    df = df[(df.index>=start) & (df.index<=end)]
    df = data.DataReader(Company_Ticker, 'stooq')


    date=df.index
    price=df['Close']

    span01=50
    span02=200

    df['sma01'] = price.rolling(window=span01).mean()
    df['sma02'] = price.rolling(window=span02).mean()

    plt.figure(figsize=(20, 10))
    plt.subplot(2,1,1)

    plt.plot(date,price,label='JP Morgan')
    plt.plot(date,df['sma01'],label='SMA(50)')
    plt.plot(date,df['sma02'],label='SMA(200)')

    plt.subplot(2,1,2)
    plt.bar(date,df['Volume'],label='Volume',color='grey')

    plt.legend()
calling the function with arguments.
Individual_Stock('2020-01-1','2023-01-23','JPM.US')
seems something wrong with my code.
---------------------------------------------------------------------------
UnboundLocalError                         Traceback (most recent call last)
/var/folders/f7/1shbvbps5872h62m_8_6r1pc0000gn/T/ipykernel_2050/2333707301.py in <module>
----> 1 Individual_Stock('2020-01-1','2023-01-23','JPM.US')

/var/folders/f7/1shbvbps5872h62m_8_6r1pc0000gn/T/ipykernel_2050/2780953359.py in Individual_Stock(start, end, Company_Ticker)
      2
      3 def Individual_Stock(start,end,Company_Ticker):
----> 4     df = df[(df.index>=start) & (df.index<=end)]
      5     df = data.DataReader(Company_Ticker, 'stooq')
      6

UnboundLocalError: local variable 'df' referenced before assignment
It says 'local variable 'df' referenced before assignment', which means that I should have defined the variable 'df' before anything else.
It should be like below.
def Individual_Stock(start,end,Company_Ticker):
    df = data.DataReader(Company_Ticker, 'stooq')
    df = df[(df.index>=start) & (df.index<=end)]
calling the function again after modification.

Done.