環境
- Angular: v9.0.4
- Node: v12.16.1
- OS: win32 x64
Chart.jsとは
Chart.jsはグラフを描画するJavaScriptライブラリである。
動的、静的グラフの両方を作成でき、様々なグラフを描画できる。
ng2-chartsについて
ng2-chartsとは
Angurlar2以降のために構築されたオープンソースのJavaScriptライブラリである。
ng2-charts:(https://www.npmjs.com/package/ng2-charts)
ng2-chartsのプロパティ
- data(Single Or Multi DataSet) - 描画するグラフのデータ。折れ線、棒、レーダー、ドーナツグラフはMultiDataSetでなければならない。それ以外はSingleDataSet。
- datasets({ data:SingleDataSet, labele: string }[]) - データの凡例とツールチップに表示されるデータセットのラベル。
- label(Label[]) - x軸のラベル。折れ線、棒、レーダーグラフには必要。
- chartType(ChartType) - チャートタイプ。グラフの種類を設定する。line, bar, radar, pie, polarArea, doughnut
- colors(Color[]) - データの色。指定なしの場合は、デフォルト値もしくはランダム値を使用される。色より多くのデータがある場合もランダム色が生成される。
- legend:(boolean = false) - trueの場合、凡例を表示する。それ以外の場合は表示されない。
ng2-chartsのイベント
- chartClick:チャートのクリックが発生すると起動。アクティブなポイントとラベルに関する情報を返す。
- chartHover:チャートでmousemove(Hover)が発生すると起動。アクティなポイントとラベルに関する情報を返す。
Angularプロジェクトに設定する
ng new angular-charts-app
cssやrouteringについてきかれるが、こだわりなければEnterで進めてよい。
プロジェクトフォルダに移動。
Angularで各チャートを表示するコンポーネントを生成する。
ng generate component bar-chart

ng g c bubble-chart # generate component略

ng g c line-chart

ng g c pie-chart

ng g c radar-chart

ng g c doughnut-chart
Chart.js、ng2-chartsライブラリを設定する
必要なjsライブラリをnpm i する。
npm install ng2-charts chart.js --save
package.json ファイル内に記述されているのを確認。
    "chart.js": "^2.9.3",
    "ng2-charts": "^2.3.0",
app.modules.ts ファイル内に ChartModule を import する。
// 変更箇所のみ記載
import { ChartsModule } from 'ng2-charts';  // 追加

...

@NgModule({
  declarations: [...],
  imports: [
    ChartsModule  // 追加
  ],
  ...
グラフの描画
各componentを記述しておく
<app-line-chart></app-line-chart>
<app-bar-chart></app-bar-chart>
<app-doughnut-chart></app-doughnut-chart>
<app-radar-chart></app-radar-chart>
<app-pie-chart></app-pie-chart>
<app-bubble-chart></app-bubble-chart>
各componentのtypescriptには ngOnInit() がデフォルトで記述されているが今回使用しないので消去して。
折れ線グラフ
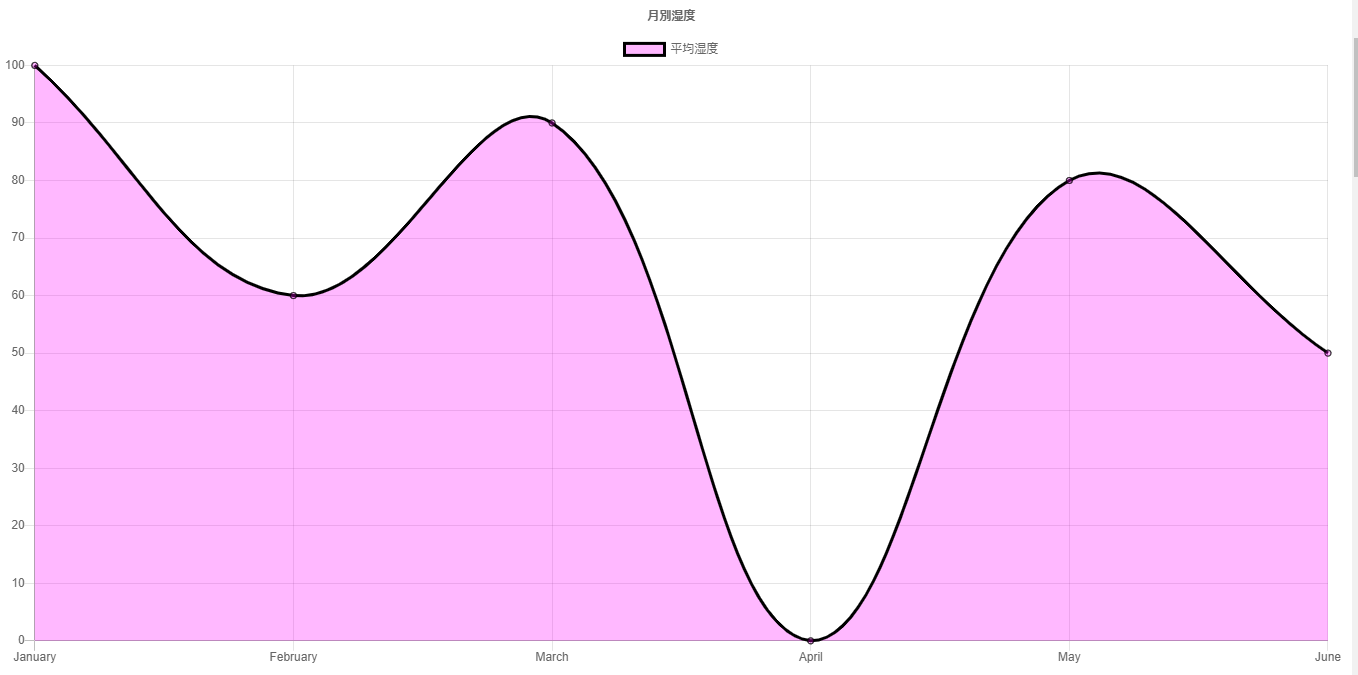
月別平均湿度をグラフ化してみる。(参考値)
line-chart.component.ts ファイルに記述する。
import { Component } from '@angular/core';
import { ChartDataSets, ChartOptions } from 'chart.js'; // データ型をimport
import { Color, Label } from 'ng2-charts'; // ng2-chartsのプロパティのデータ型をimport


@Component({
  selector: 'app-line-chart',
  templateUrl: './line-chart.component.html',
  styleUrls: ['./line-chart.component.css']
})
export class LineChartComponent {

  // data
  lineChartData: ChartDataSets[] = [
    {
      data: [100, 60, 90, 0, 80, 50],
      label: '平均湿度'
    },
  ];

  // ラベル
  lineChartLabels: Label[] = [
    'January',
    'February',
    'March',
    'April',
    'May',
    'June',
  ];

  lineChartOptions = {
    responsive: true,
  };

  // 色
  lineChartColors: Color[] = [
    {
      borderColor: 'black',
      backgroundColor: 'rgba(255,0,255,0.28)',
    },
  ];

  lineChartLegend = true; // グラフの属性ラベル
  lineChartPlugins = [];
  lineChartType = 'line'; // グラフの種類

  constructor() { } // 使わないし削除してもよい

}
line-chart.component.htmlファイルでさっきの定義した変数をプロパティに設定していく
<div>
  <canvas baseChart
    [datasets]="lineChartData"
    [labels]="lineChartLabels"
    [options]="lineChartOptions"
    [colors]="lineChartColors"
    [legend]="lineChartLegend"
    [chartType]="lineChartType"
    [plugins]="lineChartPlugins">
  </canvas>
</div>
終わり。
棒グラフ
6ヶ月の降水量をグラフ化してみる。(参考値)
import { Component } from '@angular/core';
import { ChartOptions, ChartType, ChartDataSets } from 'chart.js';
import { Label } from 'ng2-charts';

@Component({
  selector: 'app-bar-chart',
  templateUrl: './bar-chart.component.html',
  styleUrls: ['./bar-chart.component.css']
})
export class BarChartComponent {

  barChartOptions: ChartOptions = {
    responsive: true,
  };
  barChartLabels: Label[] = [
    'January',
    'February',
    'March',
    'April',
    'May',
    'June',
  ];
  barChartType: ChartType = 'bar';
  barChartLegend = true;
  barChartPlugins = [];

  barChartData: ChartDataSets[] = [
    {data: [100, 200, 70, 600, 450, 300], label: '月別降水量' }
  ];

}
<div>
  <canvas baseChart
    [datasets]="barChartData"
    [labels]="barChartLabels"
    [options]="barChartOptions"
    [plugins]="barChartPlugins"
    [legend]="barChartLegend"
    [chartType]="barChartType">
  </canvas>
</div>>
終わり。
円グラフ
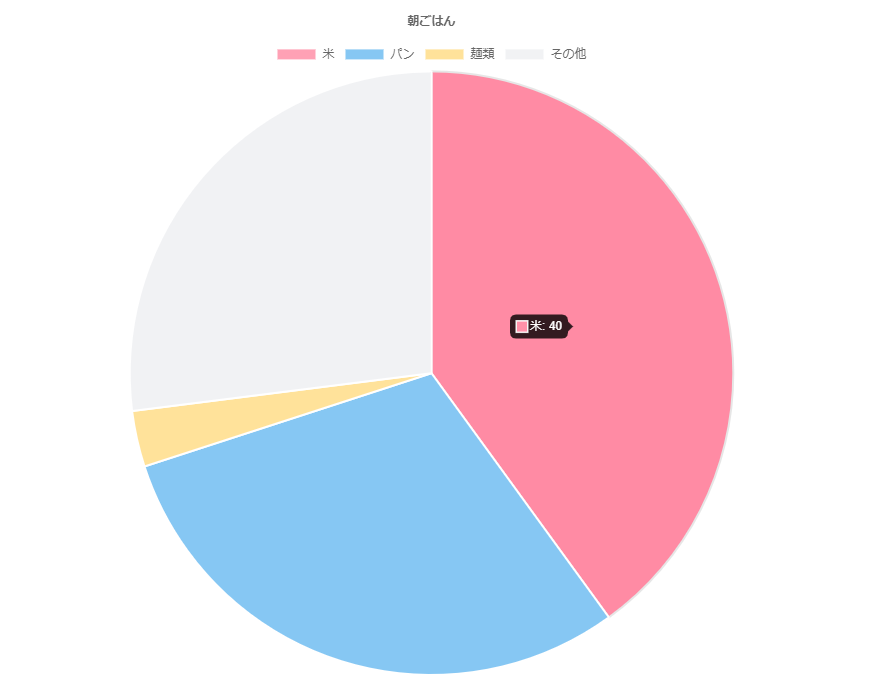
朝ごはんの割合
import { Component } from '@angular/core';
import { ChartOptions, ChartType } from 'chart.js';
import { Label, SingleDataSet } from 'ng2-charts';

@Component({
  selector: 'app-pie-chart',
  templateUrl: './pie-chart.component.html',
  styleUrls: ['./pie-chart.component.css']
})
export class PieChartComponent {

  pieChartOptions: ChartOptions = {
    responsive: true,
  };

  pieChartLabels: Label[] = ['米', 'パン', '麺類', 'その他'];

  pieChartData: SingleDataSet = [40, 30, 3, 27];

  pieChartPlugins = [];
  pieChartLegend = true;
  pieChartType: ChartType = 'pie';
}
<div>
  <canvas baseChart
    [data]="pieChartData"
    [labels]="pieChartLabels"
    [options]="pieChartOptions"
    [plugins]="pieChartPlugins"
    [legend]="pieChartLegend"
    [chartType]="pieChartType">
  </canvas>
</div>
終わり。
ドーナツグラフ
Angular, Vue, React, jQueryの使用率をグラフ化してみる(参考値)。
import { Component } from '@angular/core';
import { ChartType } from 'chart.js';
import { MultiDataSet, Label } from 'ng2-charts';

@Component({
  selector: 'app-doughnut-chart',
  templateUrl: './doughnut-chart.component.html',
  styleUrls: ['./doughnut-chart.component.css']
})
export class DoughnutChartComponent {
  doughnutChartLabels: Label[] = ['jQuey', 'React', 'Vue', 'Angular'];
  doughnutChartData: MultiDataSet = [[
    40, 30, 25, 5],
  ];
  doughnutChartType: ChartType = 'doughnut';
}
<div>
  <canvas baseChart
  [data]="doughnutChartData"
  [labels]="doughnutChartLabels"
  [chartType]="doughnutChartType">
</canvas>
</div>
レーダーチャート
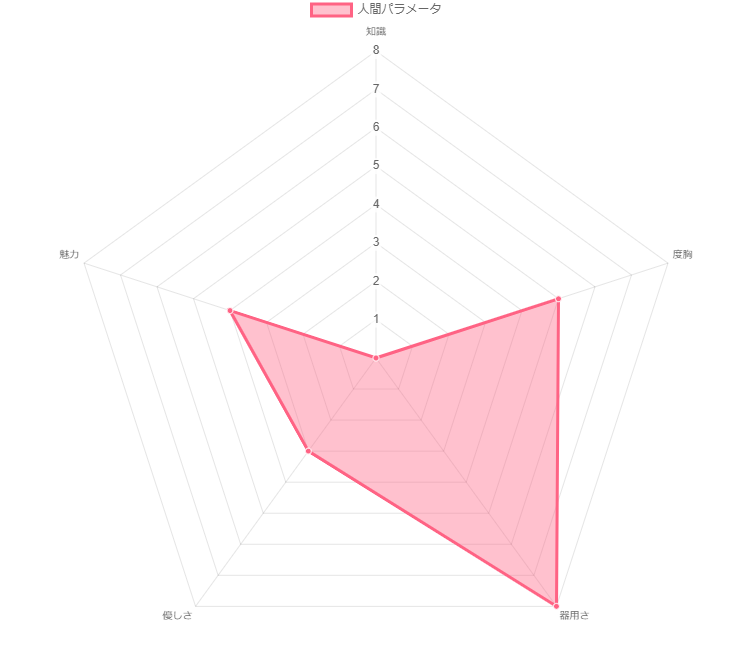
ゲームのステータスのようなレーダーチャートを作成してみる。
import { Component } from '@angular/core';
import { ChartDataSets, ChartType, RadialChartOptions } from 'chart.js';
import { Label } from 'ng2-charts';

@Component({
  selector: 'app-radar-chart',
  templateUrl: './radar-chart.component.html',
  styleUrls: ['./radar-chart.component.css']
})
export class RadarChartComponent {
  radarChartOptions: RadialChartOptions = {
    responsive: true,
  };
  radarChartLabels: Label[] = [
    '知識', '度胸', '器用さ', '優しさ', '魅力'
  ];
  radarChartData: ChartDataSets[] = [
    { data: [0, 5, 8, 3, 4], label: '人間パラメータ' }
  ];
  radarChartType: ChartType = 'radar';
}
<div>
  <canvas baseChart
    [datasets]="radarChartData"
    [options]="radarChartOptions"
    [labels]="radarChartLabels"
    [chartType]="radarChartType">
  </canvas>
</div>
終わり。
バブルチャート
import { Component } from '@angular/core';
import { ChartOptions, ChartType, ChartDataSets } from 'chart.js';
import { Color } from 'ng2-charts';

@Component({
  selector: 'app-bubble-chart',
  templateUrl: './bubble-chart.component.html',
  styleUrls: ['./bubble-chart.component.css']
})
export class BubbleChartComponent {

  bubbleChartOptions: ChartOptions = {
    title: {
      display: true,
      text: '株投資'
    },
    responsive: true,
    scales: {
      xAxes: [{
        ticks: {
          min: 0,
          max: 50,
        }
      }],
      yAxes: [{
        ticks: {
          min: 0,
          max: 50,
        }
      }]
    }
  };
  bubbleChartType: ChartType = 'bubble';
  bubbleChartLegend = true;
  bubbleChartData: ChartDataSets[] = [
    {
      data: [
        { x: 10, y: 10, r: 80 },
        { x: 20, y: 30, r: 70 },
        { x: 30, y: 20, r: 60 },
        { x: 40, y: 30, r: 50 },
        { x: 50, y: 5, r: 40 },
      ],
      label: '株投資'
    }
  ];

}
<div class="chart-wrapper">
  <canvas baseChart
  [datasets]="bubbleChartData"
  [options]="bubbleChartOptions"
  [legend]="bubbleChartLegend"
  [chartType]="bubbleChartType">
</canvas>
</div>
終わり。


