※補足
タイトルを見て「は?何言ってるの?」という方は「宇宙海賊 マダガスカル レボリューション」で検索していただければと思います。
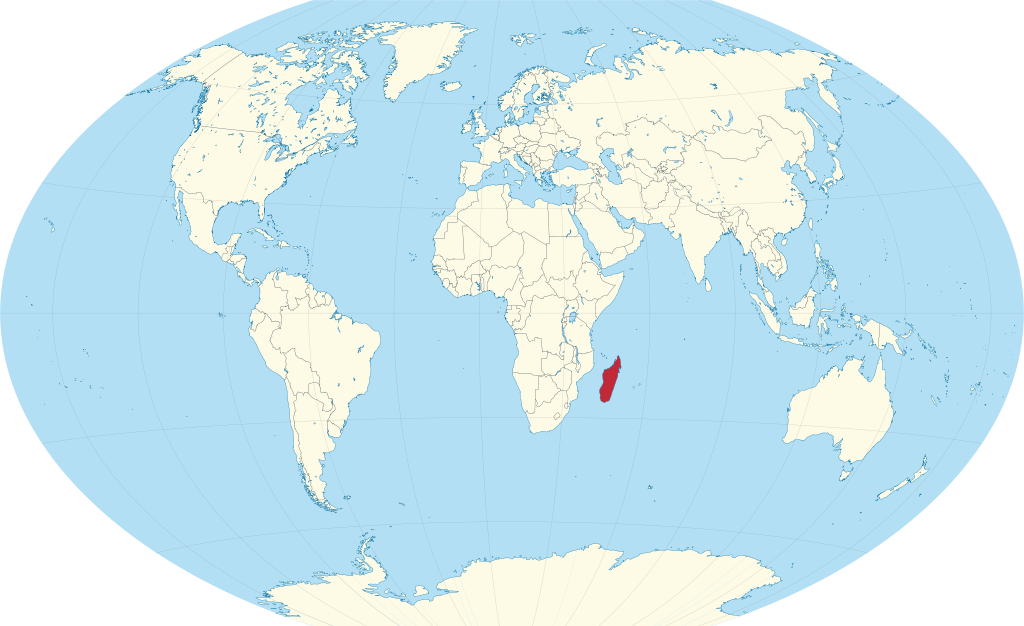
まずはマダガスカルを見つけてみましょう
💡必要なことは以下の通り
- マダガスカルの緯度経度を取得する
- 地球儀を用意してクルクルまわす
- マダガスカルで止める
Plotlyを使って実装
完成はこんな感じです。
地球儀を回してマダガスカルの場所でストップさせています。
⚓マダガスカルの緯度経度
Wikipediaで調べました。
より良い方法として、geojsonなどのデータセット使う方法もありますので、末尾に載せておきます。地図データを扱うならこちらの方がベターです。
# 緯度
lat = -18.7669
# 経度
lon = 46.8691
🌎地球儀を出す
PlotlyのScattergeoで地図を表示することができます。
日本を例に表示させてみます。
import plotly.graph_objs as go
import numpy as np

# 日本の緯度経度
lat = 35.3929
lon = 139.4428

# 日本の場所に赤点を打つ
fig= go.Figure(go.Scattergeo(
    lat=[lat],
    lon=[lon],
    mode='markers',
    marker_color='red',
    marker_size=10,
))
# 座標を調整
fig.update_layout(
    width=1000, height=1000,
    title_text='日本',
    title_x=0.5,
    geo=dict(
        # 選んだ国の座標が中心に表示されるようにする
        center_lon=lon,
        center_lat=lat,
        projection_rotation_lon=lon,
        projection_rotation_lat=lat,
        showland=True,
        showcountries=True,
        # 塗りつぶしと枠線の色
        landcolor='#99BBFF',
        countrycolor='#000000'
    )
)
fig.show()

このままでは平面図なので、丸い図形にします。図の装飾はlayut.geoのprojection_typeに好みの図法を指定すればOK!
詳しいドキュメントはこちら
球体は、projection_type = 'orthographic'です。
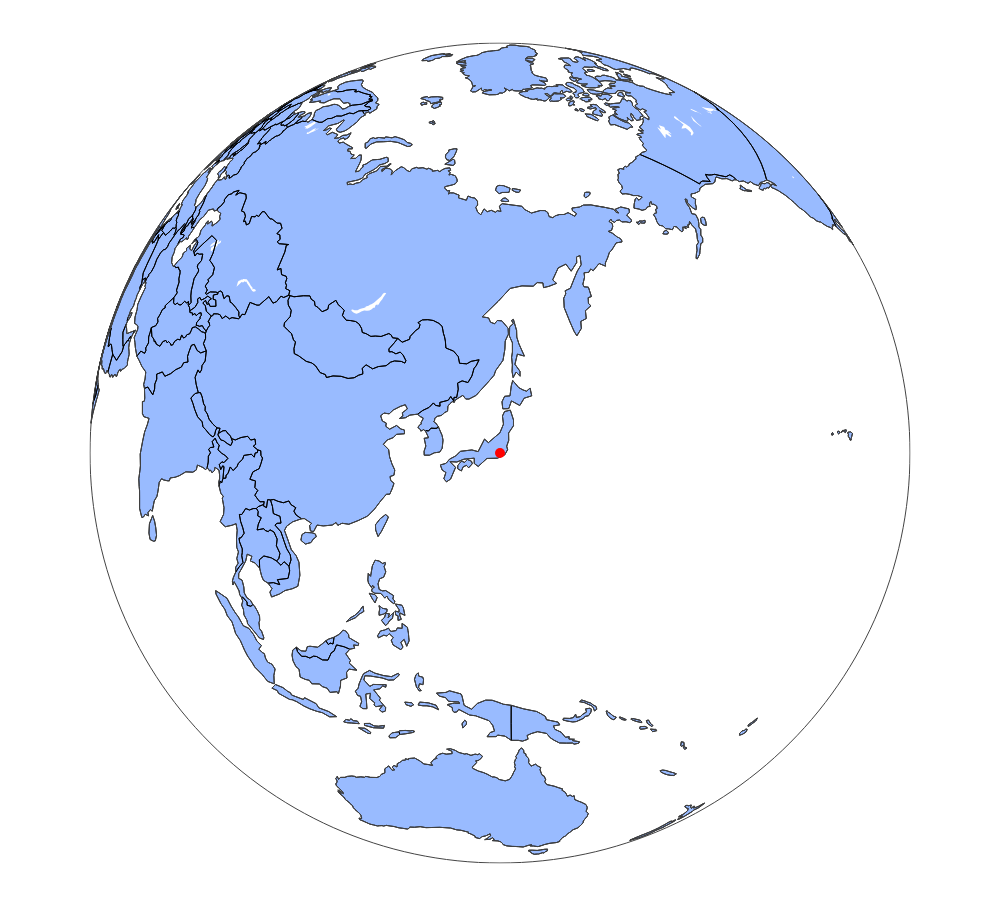
これで丸い地球儀が描けました!
コードはこちら
# 日本の緯度経度
lat = 35.3929
lon = 139.4428

# 日本の場所に赤点を打つ
fig= go.Figure(go.Scattergeo(
    lat=[lat],
    lon=[lon],
    mode='markers',
    marker_color='red',
    marker_size=10,
))
# 座標を調整
fig.update_layout(
    width=1000, height=1000,
    title_text='日本',
    title_x=0.5,
    geo=dict(
        projection_type='orthographic',# ←加えた部分
        center_lon=lon,
        center_lat=lat,
        projection_rotation_lon=lon,
        projection_rotation_lat=lat,
        showland=True,
        showcountries=True,
        landcolor='#99BBFF',
        countrycolor='#000000'
    )
)
fig.show()
🧭アニメーションをつける
graph_objs.Frameでアニメーションを追加します。
経度の方向に270度分 (90度から360度) 回転させます。
lon_range = np.arange(90+lon, 360+lon, 2)
frames = [go.Frame(layout=dict(geo_center_lon=lon,
                               geo_projection_rotation_lon=lon
                              )
                  ) for lon in lon_range]

fig.update(frames=frames)
さらに、layoutの中でボタンのコンポーネントを用意し、ボタンを押したときのアニメーションが動くようにします。
updatemenus=[
   dict(type='buttons',
        showactive=False,
        y=1,
        x=1.2,
        xanchor='right',
        yanchor='top',
        pad=dict(t=0, r=10),
        buttons=[
           dict(label='それ、、ココ!',
                method='animate',
                args=[
                    None,
                    dict(frame=dict(duration=20,
                                    redraw=True),
                         transition=dict(duration=0),
                         fromcurrent=True,
                         mode='immediate')
                ]
            )
        ]
    )
]
コードの全体はこちら
import plotly.graph_objs as go
import numpy as np

lat = -18.7669
lon = 46.8691

fig= go.Figure(go.Scattergeo(
    lat=[lat],
    lon=[lon],
    mode='markers',
    marker_color='red',
    marker_size=10,
))

fig.update_layout(
    width=500, height=500,
    title_text='マダガスカル',
    title_x=0.5,
    geo=dict(
        projection_type='orthographic',
        center_lon=100+lon,
        center_lat=0,
        projection_rotation_lon=100+lon,
        showland=True,
        showcountries=True,
        landcolor='#99BBFF',
        countrycolor='#000000'
    ),
    updatemenus=[
       dict(type='buttons',
            showactive=False,
            y=1,
            x=1.2,
            xanchor='right',
            yanchor='top',
            pad=dict(t=0, r=10),
            buttons=[
               dict(label='それ、、ココ!',
                    method='animate',
                    args=[
                        None,
                        dict(frame=dict(duration=20,
                                        redraw=True),
                             transition=dict(duration=0),
                             fromcurrent=True,
                             mode='immediate')
                    ]
                )
            ]
        )
    ]
)

lon_range = np.arange(100+lon, 360+lon, 2)
frames = [go.Frame(layout=dict(geo_center_lon=lon,
                               geo_projection_rotation_lon=lon
                              )
                  ) for lon in lon_range]

fig.update(frames=frames)
fig.show()
これを実行すると冒頭に示したような地球儀を回してマダガスカルでストップするようなアニメーションがつくれます。
もっとグルグル勢いよく回したい場合は、lon_rangeの範囲を360→720度などに変えて、durationを短くすればOKです。
おまけ
今回は座標を調べて入力するような方法でしたがgeojsonを使えば、国名から国の輪郭に沿って塗りつぶすことも簡単です。
詳しくはこちらにGitHubリンクを載せておきます。
また、地球儀のような球体の図法以外にもprojection_typeではこれだけの選択肢があります。モルワイデ図法とか懐かしいですね!
( "airy" | "aitoff" | "albers" | "albers usa" | "august" | "azimuthal equal area" | "azimuthal equidistant" | "baker" | "bertin1953" | "boggs" | "bonne" | "bottomley" | "bromley" | "collignon" | "conic conformal" | "conic equal area" | "conic equidistant" | "craig" | "craster" | "cylindrical equal area" | "cylindrical stereographic" | "eckert1" | "eckert2" | "eckert3" | "eckert4" | "eckert5" | "eckert6" | "eisenlohr" | "equal earth" | "equirectangular" | "fahey" | "foucaut" | "foucaut sinusoidal" | "ginzburg4" | "ginzburg5" | "ginzburg6" | "ginzburg8" | "ginzburg9" | "gnomonic" | "gringorten" | "gringorten quincuncial" | "guyou" | "hammer" | "hill" | "homolosine" | "hufnagel" | "hyperelliptical" | "kavrayskiy7" | "lagrange" | "larrivee" | "laskowski" | "loximuthal" | "mercator" | "miller" | "mollweide" | "mt flat polar parabolic" | "mt flat polar quartic" | "mt flat polar sinusoidal" | "natural earth" | "natural earth1" | "natural earth2" | "nell hammer" | "nicolosi" | "orthographic" | "patterson" | "peirce quincuncial" | "polyconic" | "rectangular polyconic" | "robinson" | "satellite" | "sinu mollweide" | "sinusoidal" | "stereographic" | "times" | "transverse mercator" | "van der grinten" | "van der grinten2" | "van der grinten3" | "van der grinten4" | "wagner4" | "wagner6" | "wiechel" | "winkel tripel" | "winkel3" )
試しに、こちらはprojection_type = albers にした場合です。面白い動きをしました!