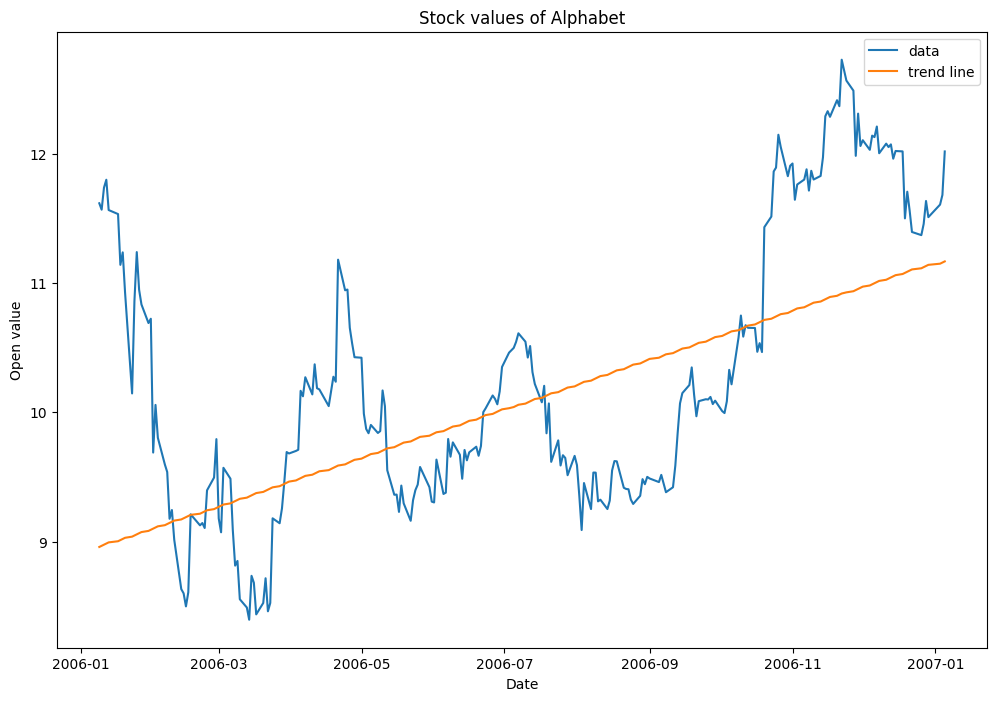
このデータは有意に上昇傾向と言えるか?
このデータは Google でおなじみの Alphabet.Inc の株価データです。今回の題材として使えるように2006年~2007年のデータを切り取りました。
(こんなに安い時期があったなんて・・・)
Mann-Kendall検定
Mann-Kendall検定はノンパラメトリックな手法で、上昇傾向・下降傾向を直感的に理解するのにとても役立ちます。
得られる結果
傾向や傾き、P値、zスコアなどを傾きの傾向に必要な情報を簡単に得ることができます。
[out]
Trend:  increasing
Slope:  0.008866691589355468
P-value:  0.0
Z-value:  8.79506893455565
準備
Mann-Kendall検定にはこちらの pymankendall のパッケージを使います。
各パッケージをインポートします。
import pandas as pd
import numpy as np
import matplotlib.pyplot as plt

!pip install pymannkendall
import pymannkendall as mk
import statsmodels.api as sm
データフレーム data を用意します。株価の時系列データが入っています。
検定
pymankedall の original_test() を使うだけでOKです!
具体的な計算式に興味がある方は記事の最後に scipy を使ったソースコードを載せています。
[in]
result = mk.original_test(data.Open)

print('Trend: ',result.trend)
print('Slope: ',result.slope)
print('P-value: ',result.p)
print('Z-value: ',result.z)

# 図の描画
trend_line = np.arange(len(data.Open)) * result.slope + result.intercept
fig, ax = plt.subplots(figsize=(12, 8))
ax.plot(data.Open)
ax.plot(data.index, trend_line)
ax.legend(['data', 'trend line'])
ax.set_title('Stock values of Alphabet')
ax.set_xlabel('Date')
ax.set_ylabel('Open value')
[out]
Trend:  increasing
Slope:  0.008866691589355468
P-value:  0.0
Z-value:  8.79506893455565
トレンドラインを描画することで、期間中にどれくらい変動することが見込めるかが簡単にわかります。
他のメソッド
original_testメソッドは系列相関や季節変動は考慮していません。例えば、hamed_rao_modification_testやyue_wang_modification_testは自己相関に対処したメソッドで、multivariate_test や seasonal_test は季節変動を考慮したメソッドです。
- Hamed and Rao Modified MK Test (hamed_rao_modification_test)
- Yue and Wang Modified MK Test (yue_wang_modification_test)
- Modified MK test using Pre-Whitening method (pre_whitening_modification_test)
- Modified MK test using Trend free Pre-Whitening method (trend_free_pre_whitening_modification_test)
- Multivariate MK Test (multivariate_test)
- Seasonal MK Test (seasonal_test)
- Regional MK Test (regional_test)
- Correlated Multivariate MK Test (correlated_multivariate_test)
- Correlated Seasonal MK Test (correlated_seasonal_test)
- Partial MK Test (partial_test)
- Theil-Sen's Slope Estimator (sens_slope)
- Seasonal Theil-Sen's Slope Estimator (seasonal_sens_slope)
実装例です。
[in]
result = mk.hamed_rao_modification_test(data.Open)

print('Trend: ',result.trend)
print('Slope: ',result.slope)
print('P-value: ',result.p)
print('Z-value: ',result.z)

# 図の描画
trend_line = np.arange(len(data.Open)) * result.slope + result.intercept
fig, ax = plt.subplots(figsize=(12, 8))
ax.plot(data.Open)
ax.plot(data.index, trend_line)
ax.legend(['data', 'trend line'])
ax.set_title('Stock values of Alphabet')
ax.set_xlabel('Date')
ax.set_ylabel('Open value')
[out]
Trend:  increasing
Slope:  0.008866691589355468
P-value:  0.028579973736528652
Z-value:  2.189232112549129
上昇傾向には変わりはありませんが、P値やzスコアに違いがありました。
参考
今回のデータセットを使いたい場合やプロジェクトをそのままフォークしたい場合はこちらをどうぞ。
- Scipyを使ったソースコード
ソースコード
import scipy as sp
def Mann_Kendall_test(x, alpha=0.05):
    x = x[~np.isnan(x)].reshape(-1)
    n = len(x)
    s = 0
    for k in range(n-1):
        for j in range(k+1, n):
            s += np.sign(x[j] - x[k])
    e = np.zeros(np.unique(x).shape)
    for i in range(len(np.unique(x))):
        e[i] = np.sum(np.unique(x)[i] == x)
    var_s = (n * (n - 1) * (2 * n + 5) + np.sum(e * (e - 1) * (2 * e + 5))) / 18
    if s > 0:
        z = (s - 1) / np.sqrt(var_s)
    elif s == 0:
        z = 0
    elif s < 0:
        z = (s + 1) / np.sqrt(var_s)
    # P-value
    p = 2 * (1 - sp.stats.norm.cdf(abs(z)))  # Two tail test
    h = abs(z) > sp.stats.norm.ppf(1 - alpha / 2)
    print('▼Mann-Kendall Test')
    print(' P-value: ', round(p,3))
    print(' Z-value ',z,round(5,3))
    if (z < 0) and h:
        print(' The null hypothesis is rejected.')
        print(' ->Decreasing')
        trend = 'Decreasing'
    elif (z > 0) and h:
        print(' The null hypothesis is rejected.')
        print('  ->Increasing')
        trend = 'Increasing'
    elif (z==0) and h:
        print(' The null hypothesis is rejected.')
        print('  ->No trends')
        trend = 'No trends'
    else:
        print(' The null hypothesis is not rejected.')
        print("  ->Can't conclude there is a trend.")
        trend = "Can't conclude there is a trend."
    return p, z, trend
[in]
p, z, trend = Mann_Kendall_test(np.array(data.Open))

[out]
▼Mann-Kendall Test
 P-value:  0.0
 Z-value  8.795063898611621 5
 The null hypothesis is rejected.
  ->Increasing


