概要
matplotlibを使って、UV-Visスペクトルを描画する手法を紹介します!
今回はpHによって、吸収スペクトルが変化するケースを例にとります。
グラフの重ね合わせ、凡例の表示、ピークラベルの表示を実装しています。
データの形式
以下の例で使用するUv-Vis.csv(こちらからダウンロード)は'wavelength'列に波長を持ち、その他の列は異なるpHごとのabs(吸光度)が入っています。
wavelength,1,2,3,4,5
750.0,0.00018,0.00033,0.0007,0.00468,0.00536
749.0,0.00018999999999999998,0.00033,0.00073,0.00468,0.005379999999999999
748.0,0.00021,0.00029,0.00074,0.00468,0.005379999999999999
...
シンプルに重ね合わせる
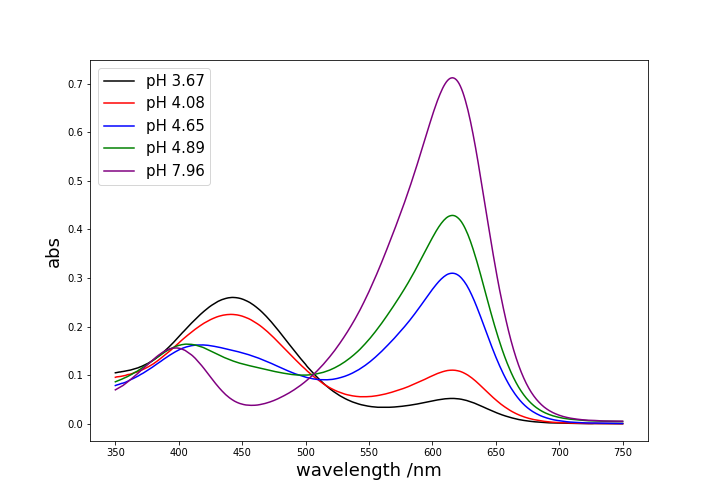
まずは、複数のグラフを重ね合わせ、それに対応する凡例を表示させます。
from matplotlib import pyplot as plt
import numpy as np

# シンプルに重ね合わせる
data = np.loadtxt("UV-Vis.csv", delimiter=",", skiprows=1)
lines = []
colors = ['black', "red", "blue", "green", "purple"]
pHs =  ['3.67', '4.08', '4.65', '4.89', '7.96']
plt.figure(figsize=(10,7))
for i in range(1, 6):
    lines.append(plt.plot(data[:, 0], data[:, i], color=colors[i-1]))
plt.xlabel("wavelength /nm", fontsize=18)
plt.ylabel("abs", fontsize=18)
plt.legend([i[0] for i in lines], ['pH {}'.format(i) for i in pHs], fontsize=15, loc='upper left')
# plt.savefig("UV-Vis.png")必要に応じて保存
こんな感じの出力。概ね良いですが、少し物足りない感じがしますね。
ピーク位置にラベルを付けましょう!
ピーク位置にラベルをつける
plt.textでラベルを付けます。
ラベルの位置については自分でいい感じに調整してください。
# ピークを位置表示
data = np.loadtxt("UV-Vis.csv", delimiter=",", skiprows=1)
lines = []
colors = ['black', "red", "blue", "green", "purple"]
pHs = ['3.67', '4.08', '4.65', '4.89', '7.96']
plt.figure(figsize=(10,7))
for i in range(1, 6):
lines.append(plt.plot(data[:, 0], data[:, i], color=colors[i-1]))
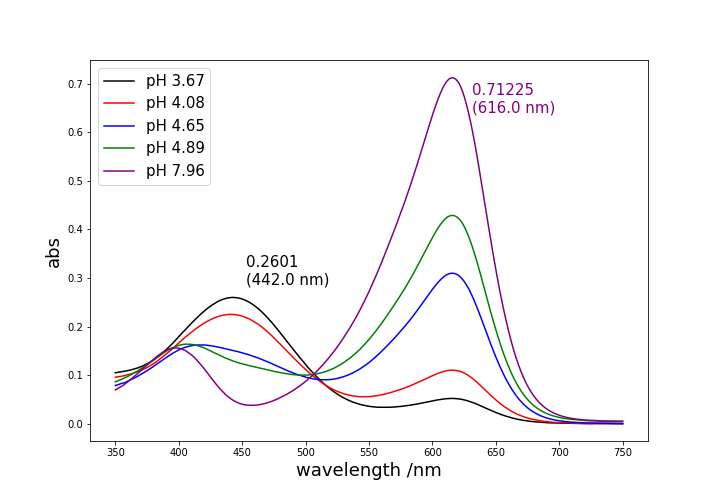
# pH 7.96の600nm付近のピーク
peak1_abs = data[:, 5].max()
peak1_wav = data[:, 0][data[:, 5].argmax()]
plt.text(peak1_wav*1.025, peak1_abs*0.9, '{}\n({} nm)'.format(peak1_abs, peak1_wav), color='purple', fontsize=15) # 位置は手動で微調整...
# pH 3.67の450nm付近のピーク
peak2_abs = data[:, 1].max()
peak2_wav = data[:, 0][data[:, 1].argmax()]
plt.text(peak2_wav*1.025, peak2_abs*1.1, '{}\n({} nm)'.format(peak2_abs, peak2_wav), color='black', fontsize=15) # 位置は手動で微調整...
plt.xlabel("wavelength /nm", fontsize=18)
plt.ylabel("abs", fontsize=18)
plt.legend([i[0] for i in lines], ['pH {}'.format(i) for i in pHs], fontsize=15, loc='upper left')
# plt.savefig("UV-Vis_label.png")
ラベルもつきいい感じになりました!
リソース
以下のrepositoryで同じことができます。
https://github.com/YutoOhno/UV-vis/tree/master