この記事の目的
データ分析において, 沢山の変数の関係性を一度に確認したい場合はどうすればいいのでしょうか?
pairplotが代表的だとおもいますが, もっとパッ!とまとめられないかと思っていたら最近, Sankey Diagramというものを知ったので描いてみました.
追記:
記事最後の追記部分を先に読んでください.
Plotly Sankey Diagram の使い方
Plotly を使えばかけるそうなので, まずは公式サイトのサンプルコードを丸写しして, 動くか確認してみます.
import plotly.graph_objects as go

fig = go.Figure(data=[go.Sankey(
    node = dict(
      pad = 15,
      thickness = 20,
      line = dict(color = "black", width = 0.5),
      label = ["A1", "A2", "B1", "B2", "C1", "C2"],
      color = "blue"
    ),
    link = dict(
      source = [0, 1, 0, 2, 3, 3], # indices correspond to labels, eg A1, A2, A2, B1, ...
      target = [2, 3, 3, 4, 4, 5],
      value = [8, 4, 2, 8, 4, 2]
  ))])

fig.update_layout(title_text="Basic Sankey Diagram", font_size=10)
fig.show()
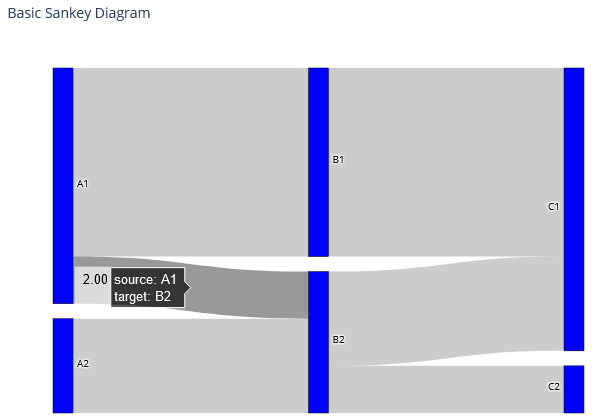
動きました!
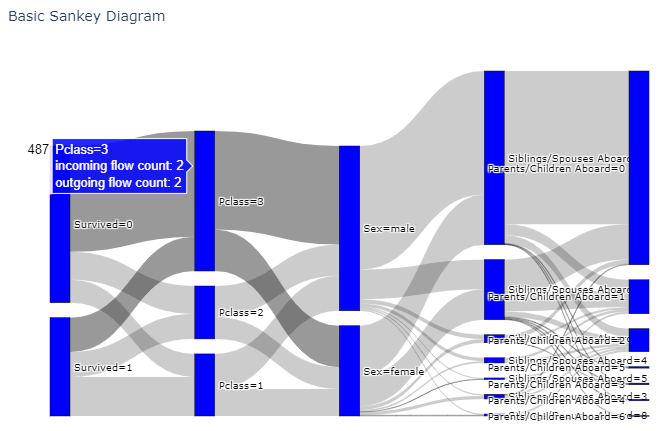
マウスを重ねるとその部分の詳細まで表示されるのが良いですね!
matplotlibやseabornに比べてコードが長くて大変ですが, 重要なのは以下の部分です.
label = ["A1", "A2", "B1", "B2", "C1", "C2"],
source = [0, 1, 0, 2, 3, 3],
target = [2, 3, 3, 4, 4, 5],
value = [8, 4, 2, 8, 4, 2]
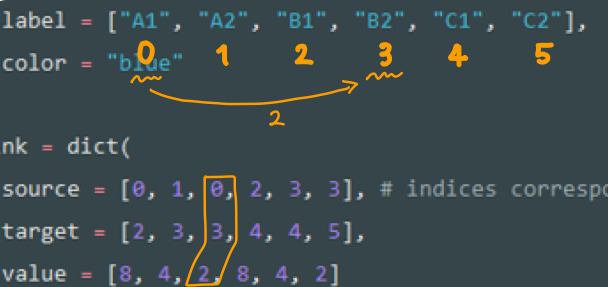
例えば, 上のSankey Diagram図で, source:A1, target:B2, 2.00となっているのは, 下図linkの中の3つのリストのオレンジ部分が対応しています.
「label[0]からlabel[3]に2だけ流れる」ということですね.
このようにノードの始点と終点, そしてそこを流れるフローの量を指定するリストを作成できれば, Sankey Diagramは描けます!
データフレームからSankey Diagram を描く
ということで, 本題のデータフレームからSankey Diagram作成に入っていきます.
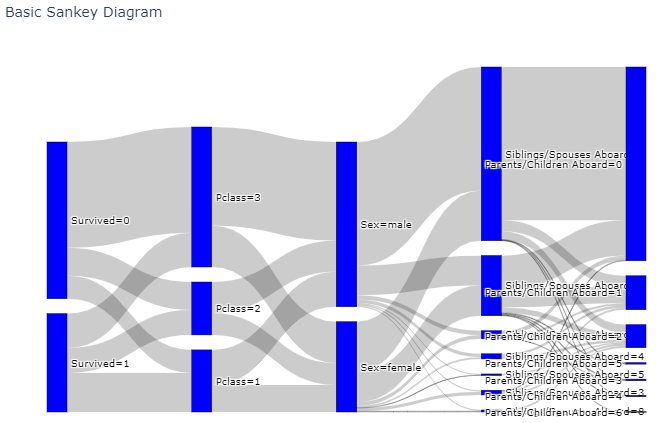
先に結果をお見せすると, 今回は, タイタニック号のデータを用いて以下のような図を作成しました.
解説
ライブラリを読み込みます.
import numpy as np
import pandas as pd
import plotly.graph_objects as go
データをダウンロードしてきます.
!wget https://web.stanford.edu/class/archive/cs/cs109/cs109.1166/stuff/titanic.csv
データを読み込み, 今回はカテゴリ変数と整数値の変数だけ表示するので, 変数名を絞ります.
filename = "/content/titanic.csv"
df = pd.read_csv(filename, encoding='utf-8')

cate_list = ["Survived", "Pclass", "Sex", "Siblings/Spouses Aboard", "Parents/Children Aboard"]

n = len(cate_list)
次にlabel_listを作成します.
label_list = []
source_list = []
target_list = []
value_list = []

for cate in cate_list:
    tmp_label_list=[]
    for v in df[cate].unique():
        lab = "{0}={1}".format(cate, v)
        tmp_label_list.append(lab)
        tmp_label_list.sort()
    label_list.extend(tmp_label_list)
link情報の3つのリストを作成します.
for i in range(n-1):
    source_cate = cate_list[i]
    target_cate = cate_list[i+1]

    for sc in df[source_cate].unique():
        for tc in df[target_cate].unique():

            v = sum((df[source_cate]==sc) & (df[target_cate]==tc))
            source_lab = "{0}={1}".format(source_cate, sc)
            target_lab = "{0}={1}".format(target_cate, tc)

            source_list.append(source_lab)
            target_list.append(target_lab)
            value_list.append(v)
最後に, source_listとtarget_listはindexで指定しなければいけないので,
label_listを参照して変換します.
source_list = [label_list.index(si) for si in source_list]
target_list = [label_list.index(ti) for ti in target_list]
あとは, サンプルと同じコードを実行するだけです.
fig = go.Figure(data=[go.Sankey(
    node = dict(
      pad = 15,
      thickness = 20,
      line = dict(color = "black", width = 0.5),
      label = label_list,
      color = "blue"
    ),
    link = dict(
      source = source_list,
      target = target_list,
      value = value_list
  ))])

fig.update_layout(title_text="Basic Sankey Diagram", font_size=10)
fig.show()
以上!
コード一覧
一覧を表示
import numpy as np
import pandas as pd

!wget https://web.stanford.edu/class/archive/cs/cs109/cs109.1166/stuff/titanic.csv

filename = "/content/titanic.csv"
df = pd.read_csv(filename, encoding='utf-8')

cate_list = ["Survived", "Pclass", "Sex", "Siblings/Spouses Aboard", "Parents/Children Aboard"]

n = len(cate_list)

label_list = []
source_list = []
target_list = []
value_list = []

for cate in cate_list:
    tmp_label_list=[]
    for v in df[cate].unique():
        lab = "{0}={1}".format(cate, v)
        tmp_label_list.append(lab)
        tmp_label_list.sort()
    label_list.extend(tmp_label_list)


for i in range(n-1):
    source_cate = cate_list[i]
    target_cate = cate_list[i+1]

    for sc in df[source_cate].unique():
        for tc in df[target_cate].unique():

            v = sum((df[source_cate]==sc) & (df[target_cate]==tc))
            source_lab = "{0}={1}".format(source_cate, sc)
            target_lab = "{0}={1}".format(target_cate, tc)

            source_list.append(source_lab)
            target_list.append(target_lab)
            value_list.append(v)

source_list = [label_list.index(si) for si in source_list]
target_list = [label_list.index(ti) for ti in target_list]

fig = go.Figure(data=[go.Sankey(
    node = dict(
      pad = 15,
      thickness = 20,
      line = dict(color = "black", width = 0.5),
      label = label_list,
      color = "blue"
    ),
    link = dict(
      source = source_list,
      target = target_list,
      value = value_list
  ))])

fig.update_layout(title_text="Basic Sankey Diagram", font_size=10)
fig.show()
あとがき
実は, 自分でコードを書いてみて気づいたのですが, この図はある変数の前後の変数との関係性しかわかりません.
上図の例だと, SurvivedとPclassや, PclassとSexの関係性は分かっても, SurvivedとSexがわかりません. 色などで分ければ, 3変数までは表現できそうですが, それ以上となるとやはり無理そうです.
(あれ, これって4次元以上の可視化になってなくない...?)
もっとよい方法をご存じの方は, コメントで教えていただけると幸いです.
追記
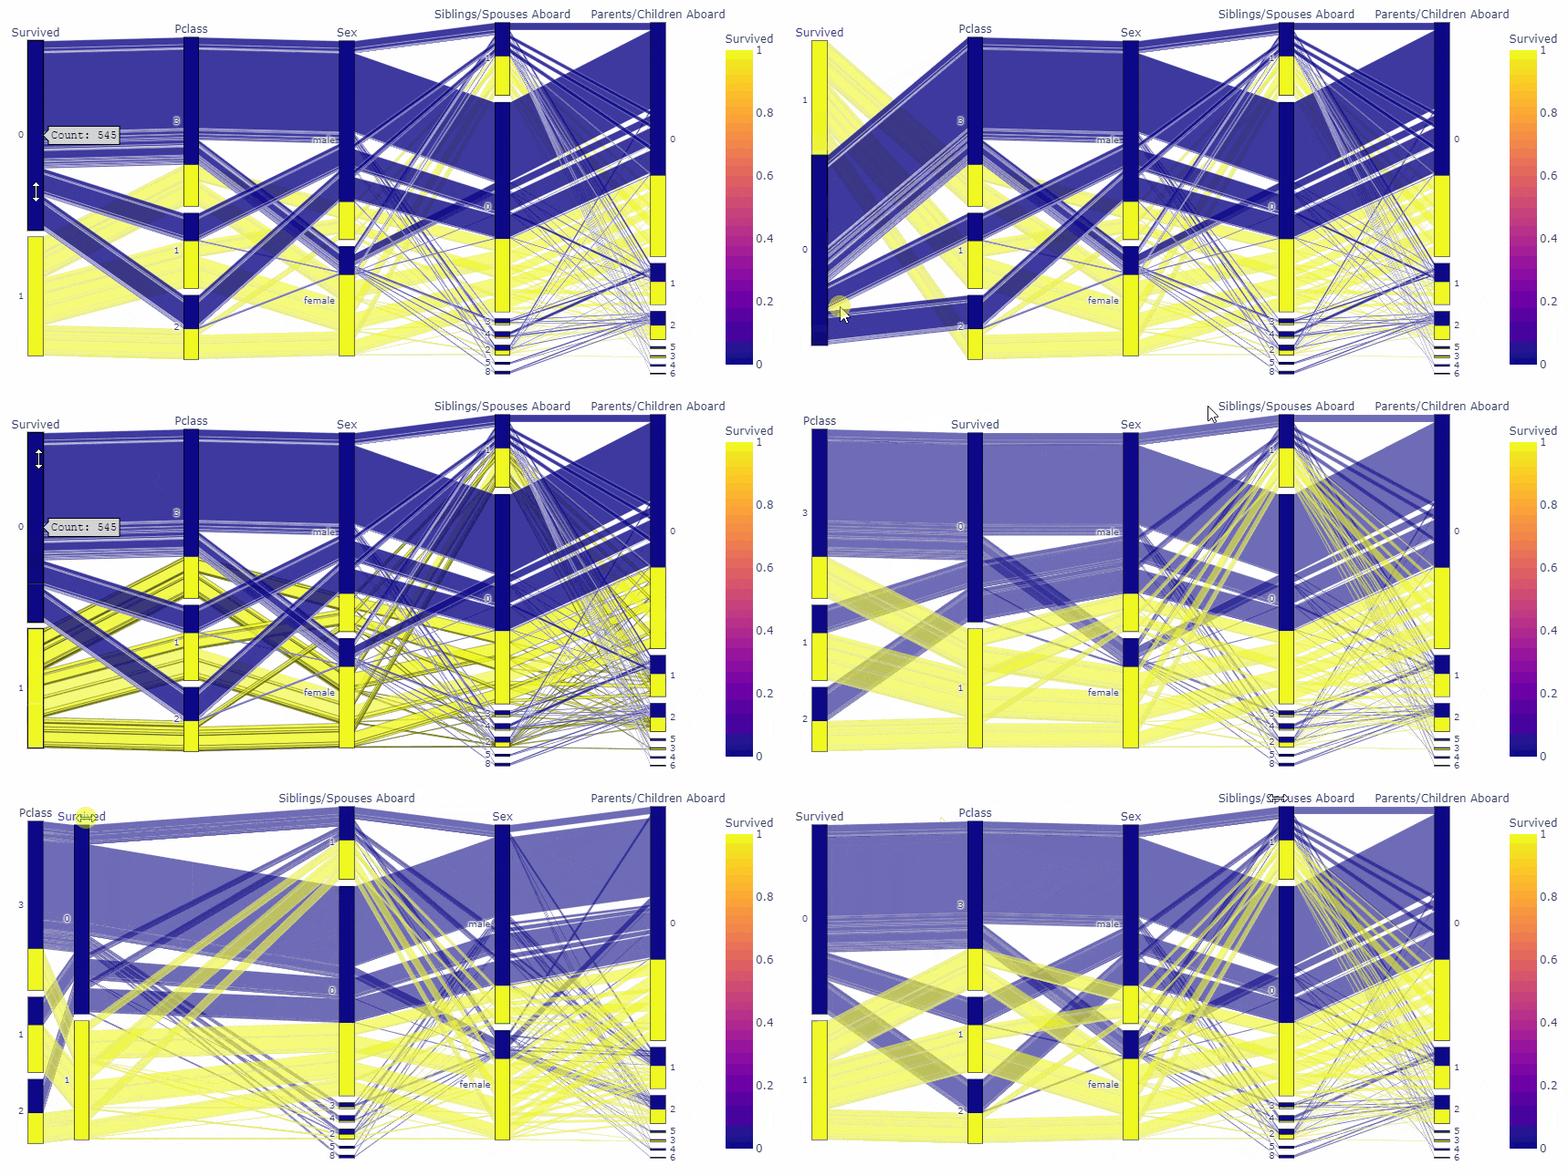
上でいろいろやっていますが, ドキュメントを読んでいたらもっと簡単な方法がありました.
fig = px.parallel_categories(df, dimensions=cate_list, color='Survived')
fig.show()
変数の順番や、要素の順番まで動かせるのは凄いですね!!
以上!
参考
Plotly:Sankey Diagram in Python
Plotly:basic-parallel-category-diagram-with-plotlyexpress
CS109:A Titanic Probability
