参考
https://prometheus.io/docs/prometheus/latest/getting_started/
https://ytsuboi.jp/archives/400
Prometheusのセットアップ
tar xvfz prometheus-*.tar.gz
cd prometheus-*
prometheus.yaml
global:
  scrape_interval:     15s # By default, scrape targets every 15 seconds.

  # Attach these labels to any time series or alerts when communicating with
  # external systems (federation, remote storage, Alertmanager).
  external_labels:
    monitor: 'codelab-monitor'

# A scrape configuration containing exactly one endpoint to scrape:
# Here it's Prometheus itself.
scrape_configs:
  # The job name is added as a label `job=<job_name>` to any timeseries scraped from this config.
  - job_name: 'prometheus'

    # Override the global default and scrape targets from this job every 5 seconds.
    scrape_interval: 5s

    static_configs:
      - targets: ['localhost:9090']
起動
./prometheus --config.file=prometheus.yml
GUIで確認

NodeExporterでKubernetesNodeを監視する
specファイルの作成
node-exporter-daemonset.yml
apiVersion: apps/v1
kind: DaemonSet
metadata:
  name: node-exporter
  namespace: monitoring
spec:
  selector:
    matchLabels:
      app: node-exporter
  template:
    metadata:
      labels:
        app: node-exporter
      annotations:
        prometheus.io/scrape: 'true'
        prometheus.io/port: '9100'
        prometheus.io/path: '/metrics'
    spec:
      containers:
      - name: node-exporter
        image: quay.io/prometheus/node-exporter
        ports:
        - containerPort: 9100
      hostNetwork: true
      hostPID: true
namespaceの追加
kubectl create ns monitoring
サービスアカウントの追加
kubectl -n monitoring create serviceaccount prometheus
cluster-admin権限を付与する
kubectl -n monitoring create clusterrolebinding prometheus-clusterrolebinding --clusterrole=cluster-admin --serviceaccount=monitoring:prometheus
NodeExporterをデプロイ
kubectl apply -f node-exporter-daemonset.yml
各Nodeに散らばってデプロイされていることを確認
yuta:~ $ kubectl get pod -o wide -n monitoring
NAME                  READY   STATUS    RESTARTS   AGE   IP              NODE                                               NOMINATED NODE   READINESS GATES
node-exporter-4jrd4   1/1     Running   0          27m   172.16.52.156   ip-172-16-52-156.ap-northeast-1.compute.internal   <none>           <none>
node-exporter-mwnj7   1/1     Running   0          27m   172.16.53.43    ip-172-16-53-43.ap-northeast-1.compute.internal    <none>           <none>
PrometheusへのNodeExporter設定を追加
-
- job_name: 'k8s-node-exporter'から追加 -
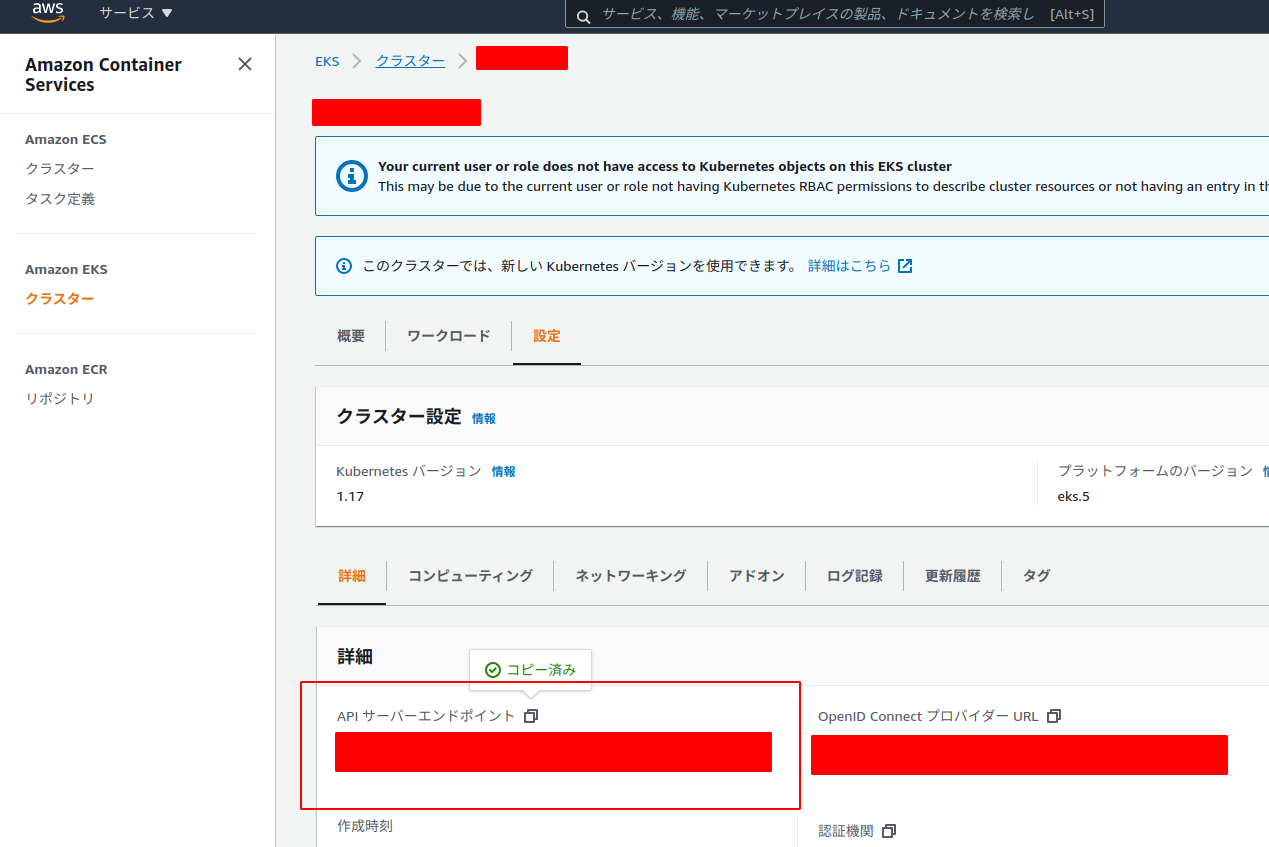
api_serverは、EKSの場合コンソールから確認できるAPIサーバーエンドポイントになる -
bearer_tokenは、kubectl -n monitoring get secret prometheus-token-xxxxx -o 'jsonpath={$.data.token}' | base64 -d
# my global config
global:
  scrape_interval:     15s # Set the scrape interval to every 15 seconds. Default is every 1 minute.
  evaluation_interval: 15s # Evaluate rules every 15 seconds. The default is every 1 minute.
  # scrape_timeout is set to the global default (10s).

# Alertmanager configuration
alerting:
  alertmanagers:
  - static_configs:
    - targets:
      # - alertmanager:9093

# Load rules once and periodically evaluate them according to the global 'evaluation_interval'.
rule_files:
  # - "first_rules.yml"
  # - "second_rules.yml"

# A scrape configuration containing exactly one endpoint to scrape:
# Here it's Prometheus itself.
scrape_configs:
  # The job name is added as a label `job=<job_name>` to any timeseries scraped from this config.
  - job_name: 'prometheus'

    # metrics_path defaults to '/metrics'
    # scheme defaults to 'http'.

    static_configs:
    - targets: ['localhost:9090']

  - job_name: 'k8s-node-exporter'
    # Config for kubernetes
    kubernetes_sd_configs:
      - role: pod
        api_server: "https://E3EEEEF85708271BAE16FF9CEC7C87F7.gr7.ap-northeast-1.eks.amazonaws.com"
        namespaces:
          names:
            - monitoring
        tls_config:
          insecure_skip_verify: true

        bearer_token: eyJhbGciOiJSUzI1NiIsImtpZCI6IlJWRnprZndyU2JrYzF3TWl0UzNlcmpTYlhORW1XZUVFUE5HVERKRXd1NDgifQ.eyJpc3MiOiJrdWJlcm5ldGVzL3NlcnZpY2VhY2NvdW50Iiwia3ViZXJuZXRlcy5pby9zZXJ2aWNlYWNjb3VudC9uYW1lc3BhY2UiOiJtb25pdG9yaW5nIiwia3ViZXJuZXRlcy5pby9zZXJ2aWNlYWNjb3VudC9zZWNyZXQubmFtZSI6InByb21ldGhldXMtdG9rZW4tZmRoYzUiLCJrdWJlcm5ldGVzLmlvL3NlcnZpY2VhY2NvdW50L3NlcnZpY2UtYWNjb3VudC5uYW1lIjoicHJvbWV0aGV1cyIsImt1YmVybmV0ZXMuaW8vc2VydmljZWFjY291bnQvc2VydmljZS1hY2NvdW50LnVpZCI6ImM0Mzg4ZTE0LTc0N2EtNGM2OS1iYzE1LWRiNWQzOTgyZWRmMSIsInN1YiI6InN5c3RlbTpzZXJ2aWNlYWNjb3VudDptb25pdG9yaW5nOnByb21ldGhldXMifQ.t0R-V14Ayw3SGMmpgJxwRKnda2sBlhETIVr6L4XsKw4IzNPhbA1RxBnkwQS77LuwVOLow-GVA4se3U53-5w85OVqwQAG9eDRPac3Ztmr0oWqr1rzZ5qyrlkSt7rOlR2_LETTIFjozzulE81abG72cK94_JCgfzVB0Enz078aFIEzwaTdshkehQOW2QO1pNMv5YGeHgSgy1EctZ-kHoaiXF6mwjvP3vXDCZdSVNWX_Lif92z7ja3LdjBktFtUfd4d0Y71ubfyq-le418qbtOIpr8I4OzuyOvFr-ZYLSjEczhitqCkbji9RjQpSLOvWgLIwr4Tln68w7tJEidtaqnrnA

    relabel_configs:
      - source_labels: [__meta_kubernetes_pod_annotation_prometheus_io_scrape]
        action: keep
        regex: true
      - source_labels: [__meta_kubernetes_pod_annotation_prometheus_io_path]
        action: replace
        target_label: __metrics_path__
        regex: (.+)
      - source_labels: [__address__, __meta_kubernetes_pod_annotation_prometheus_io_port]
        action: replace
        regex: (.+):(?:\d+);(\d+)
        replacement: ${1}:${2}
        target_label: __address__
      - action: labelmap
        regex: __meta_kubernetes_pod_label_(.+)