はじめに
回帰分析は、幅広い分野でデータ解析の中心的手法として広く利用されています。特に、最小二乗法(OLS: Ordinary Least Squares)は広く用いられていますが、説明変数 $x$ と応答変数 $y$ の両方に測定誤差が含まれる場合、標準的なOLSでは不十分です。この問題を解決するためには、直交距離回帰(ODR: Orthogonal Distance Regression)が有効です。本記事では、ODRの基本的な概念と、PythonライブラリSciPyを用いた実装方法について説明します。
本記事の実装コードはこちらからもご覧いただけます。
OLSとODRの違い
ODRは、標準的なOLSがデータ点の誤差を縦方向(応答変数 $y$ の方向)にのみ考慮するのに対して、説明変数(独立変数 $x$)の誤差も含めて全体の誤差を最小化するアプローチです。これにより、縦方向と横方向の両方に誤差がある場合でも、より高精度な回帰分析が可能になります。
数式による説明
OLSとODRの違いを数式で説明します。以下の図を用いると、これらの違いが分かりやすくなります。
OLSでは、回帰モデル $y = f(x; \boldsymbol{\beta})$($\boldsymbol{\beta}$ はパラメータベクトル)において、データ点が$n$個あるとき、縦方向の誤差を次の式で最小化します。
\text{OLS: } \min_{\boldsymbol{\beta}} \sum_{i=1}^{n} \frac{(y_i - f(x_i; \boldsymbol{\beta}))^2}{\sigma_{y_i}^2}
一方、ODRは説明変数 $x$ と応答変数 $y$ の両方に誤差がある場合に適した回帰手法です。ODR では、次の数式に基づき、全体の誤差を最小化します。
\begin{align}
\text{ODR: }& \min_{\boldsymbol{\beta}} \sum_{i=1}^{n} \left\{ \frac{[x_i - (x_i + \Delta x_i)]^2}{\sigma_{x_i}^2} + \frac{[y_i - f(x_i + \Delta x_i; \boldsymbol{\beta})]^2}{\sigma_{y_i}^2} \right\} \\
= &\min_{\boldsymbol{\beta}} \sum_{i=1}^{n} \left\{ \frac{(\Delta x_i)^2}{\sigma_{x_i}^2} + \frac{(\Delta y_i)^2}{\sigma_{y_i}^2} \right\}\\
\end{align}
ここで、$\sigma_{x_i}$ と $\sigma_{y_i}$ は $x$ と $y$ の測定誤差の標準偏差を表します。ODRでは、OLSの基本的な要素も取り入れています。具体的に言えば、誤差を$\sigma_{x_i}^2$や$\sigma_{y_i}^2$で割るという重み付けの考え方は、OLSにおける応答変数$y$の誤差に対する重み付けと同様です。OLSでは、観測データの不確かさを重み付けして回帰を行いますが、ODRはこれを拡張し、$x$と$y$の両方の誤差を考慮して重み付けを行います。このため、ODRは$x$と$y$の誤差の程度をバランスよく評価し、OLSよりも多様な誤差条件に適応した回帰分析が可能になります。
SciPyを使った実装方法
Pythonでは、scipy.odrモジュールを使用してODRを実装できます。ここでは、基本的な実装手順を説明し、実際のコード例を紹介します。
ODRの実装手順は以下の通りです。
- モデル関数の定義
- データの生成と観測誤差の設定
-
RealDataクラスを使用してデータを作成 -
ODRクラスを用いて回帰を実行
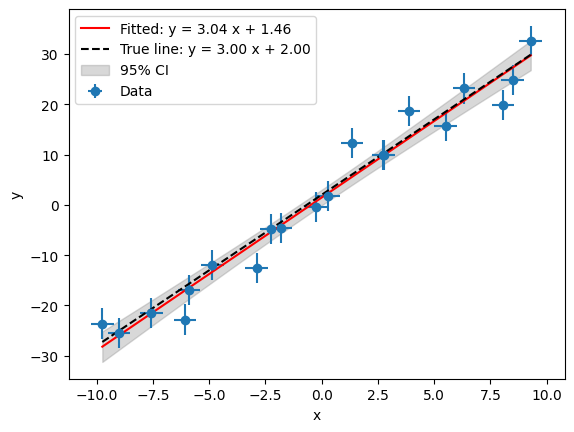
線形回帰モデルの例
まず、線形モデルを使用したODRの実装例を紹介します。 モデルは次のように表されます。
y = f(x; a, b) = ax+b
import numpy as np
import matplotlib.pyplot as plt
from scipy.odr import ODR, Model, RealData

# 線形モデル
def linear_model(params, x):
    a, b = params
    return a * x + b

# サンプルデータ生成(直線)
np.random.seed(42)
x_true = np.linspace(-10, 10, 20)
params_true = [3.0, 2.0]
y_true = linear_model(params_true, x_true)

# ノイズを加えた観測データ
x_obs = x_true + np.random.normal(0, 0.5, size=x_true.size)
y_obs = y_true + np.random.normal(0, 3.0, size=y_true.size)
x_err = np.full_like(x_obs, 0.5)  # x の誤差
y_err = np.full_like(y_obs, 3.0)  # y の誤差

# ODR 用データとモデルの設定
data = RealData(x_obs, y_obs, sx=x_err, sy=y_err)
model = Model(linear_model)

# ODR 実行
odr_instance = ODR(data, model, beta0=[1.0, 1.0])
output = odr_instance.run()

# フィッティング結果
popt = output.beta
perr = output.sd_beta
print(f"True param: y = {params_true[0]:.2f} x + {params_true[1]:.2f}")
print(f"Fitting result: y = {popt[0]:.2f} x + {popt[1]:.2f}")
print(f"Parameter uncertainty: a_err={perr[0]:.2f}, b_err={perr[1]:.2f}")

# 信頼区間の計算
nstd = 1.96  # 95% 信頼区間
x_fit = np.linspace(x_obs.min(), x_obs.max(), 100)
y_fit = linear_model(popt, x_fit)

# 答えの曲線をプロット
y_true_fit = linear_model(params_true, x_fit)

# 予測区間の計算
y_fit_err = np.sqrt((x_fit**2) * perr[0]**2 + perr[1]**2)
y_fit_up = y_fit + nstd * y_fit_err
y_fit_dw = y_fit - nstd * y_fit_err

# プロット
plt.errorbar(x_obs, y_obs, xerr=x_err, yerr=y_err, fmt='o', label="Data")
plt.plot(x_fit, y_fit, label=f"Fitted: y = {popt[0]:.2f} x + {popt[1]:.2f}", color='r')
plt.plot(x_fit, y_true_fit, label="True line", linestyle='--', color='k')
plt.fill_between(x_fit, y_fit_up, y_fit_dw, color='gray', alpha=0.3, label='95% CI')
plt.xlabel("x")
plt.ylabel("y")
plt.legend()
plt.show()
コードの説明
-
RealDataクラス: 誤差のある観測データを取り扱うためのクラス。sxとsyで$x$と$y$の誤差を設定します。 -
Modelクラス: 回帰に使用するモデル関数を定義します。 -
ODRクラス: ODRの実行に使用し、初期パラメータbeta0を指定して回帰を行います。
信頼区間は誤差伝搬から計算します。
\begin{align}
\sigma_f &= \sqrt{\left( \frac{\partial f}{\partial a} \sigma_a \right)^2 + \left( \frac{\partial f}{\partial b} \sigma_b \right)^2}\\
&= \sqrt{x^2 \sigma_a^2 + \sigma_b^2}
\end{align}
非線形関数の例
ODRは非線形モデルにも対応しています。ここでは、例として3次関数を用いたODRの実装を紹介します。
線形回帰モデルの例と内容が重複するため折りたたんでいます。必要に応じて開いてご覧ください。
y = f(x; a, b, c, d) = ax^3 + bx^2 + cx + d
import numpy as np
import matplotlib.pyplot as plt
from scipy.odr import ODR, Model, RealData

# 3次関数モデル
def cubic_model(params, x):
    a, b, c, d = params
    return a * x**3 + b * x**2 + c * x + d

# サンプルデータ生成(3次関数)
np.random.seed(42)
x_true = np.linspace(-10, 10, 20)
params_true = [1.0, -2.0, 3.0, 4.0]
y_true = cubic_model(params_true, x_true)

# ノイズを加えた観測データ
x_obs = x_true + np.random.normal(0, 0.5, size=x_true.size)
y_obs = y_true + np.random.normal(0, 50.0, size=y_true.size)
x_err = np.full_like(x_obs, 0.5)  # x の誤差
y_err = np.full_like(y_obs, 50.0)  # y の誤差

# ODR 用データとモデルの設定
data = RealData(x_obs, y_obs, sx=x_err, sy=y_err)
model = Model(cubic_model)

# ODR 実行
odr_instance = ODR(data, model, beta0=[1.0, -1.0, 1.0, 1.0])
output = odr_instance.run()

# フィッティング結果
popt = output.beta
perr = output.sd_beta
print(f"True param: y = {params_true[0]:.2f} x^3 + {params_true[1]:.2f} x^2 + {params_true[2]:.2f} x + {params_true[3]:.2f}")
print(f"Fitting result: y = {popt[0]:.2f} x^3 + {popt[1]:.2f} x^2 + {popt[2]:.2f} x + {popt[3]:.2f}")
print(f"Parameter uncertainty: a_err={perr[0]:.2f}, b_err={perr[1]:.2f}, c_err={perr[2]:.2f}, d_err={perr[3]:.2f}")

# 信頼区間の計算
nstd = 1.96  # 95% 信頼区間
x_fit = np.linspace(x_obs.min(), x_obs.max(), 100)
y_fit = cubic_model(popt, x_fit)

# 答えの曲線をプロット
y_true_fit = cubic_model(params_true, x_fit)

# 信頼区間の計算
y_fit_err = np.sqrt((x_fit**6) * perr[0]**2 + (x_fit**4) * perr[1]**2 + (x_fit**2) * perr[2]**2 + perr[3]**2)
y_fit_up = y_fit + nstd * y_fit_err
y_fit_dw = y_fit - nstd * y_fit_err

# プロット
plt.errorbar(x_obs, y_obs, xerr=x_err, yerr=y_err, fmt='o', label="Data")
plt.plot(x_fit, y_fit, label=f"Fitted: y = {popt[0]:.2f} x$^3$ + {popt[1]:.2f} x$^2$ + {popt[2]:.2f} x + {popt[3]:.2f}", color='r')
plt.plot(x_fit, y_true_fit, label=f"True curve: y = {popt[0]:.2f} x^3 + {popt[1]:.2f} x^2 + {popt[2]:.2f} x + {popt[3]:.2f}", linestyle='--', color='k')
plt.fill_between(x_fit, y_fit_up, y_fit_dw, color='gray', alpha=0.3, label='95% CI')
plt.xlabel("x")
plt.ylabel("y")
plt.legend()
plt.show()
先ほどと同様に誤差伝搬の法則により信頼区間を求めます。
\begin{align}
\sigma_f &= \sqrt{\left( \frac{\partial y}{\partial a} \sigma_a \right)^2 + \left( \frac{\partial y}{\partial b} \sigma_b \right)^2 + \left( \frac{\partial y}{\partial c} \sigma_c \right)^2 + \left( \frac{\partial y}{\partial d} \sigma_d \right)^2}\\
&= \sqrt{x^6 \sigma_a^2 + x^4 \sigma_b^2 + x^2 \sigma_c^2 + \sigma_d^2}
\end{align}
陰関数の例
最後に、陰関数を使用した例として円のフィッティングを紹介します。
x^2+y^2-r^2=0
import numpy as np
import matplotlib.pyplot as plt
from scipy.odr import ODR, Model, RealData
from matplotlib.patches import Circle

# 円の陰関数モデル
def circle_model(params, data):
    r = params[0]
    x, y = data
    return (x**2 + y**2) - r**2

# サンプルデータ生成(円)
np.random.seed(42)
theta = np.linspace(0, 2 * np.pi, 60)
r_true = 5.0
x_true = r_true * np.cos(theta)
y_true = r_true * np.sin(theta)

# ノイズを加えた観測データ
x_obs = x_true + np.random.normal(0, 0.5, size=x_true.size)
y_obs = y_true + np.random.normal(0, 0.5, size=y_true.size)
x_err = np.full_like(x_obs, 0.5)  # x の誤差
y_err = np.full_like(y_obs, 0.5)  # y の誤差

# ODR 用データとモデルの設定
data = RealData(x=np.array([x_obs, y_obs]), y=1, sx=np.array([x_err, y_err]))
model = Model(circle_model, implicit=True)

# ODR 実行
odr_instance = ODR(data, model, beta0=[4.0])
output = odr_instance.run()

# フィッティング結果
r_fit = output.beta[0]
r_err = output.sd_beta[0]
print(f"True param: y = (x^2 + y^2) = {r_true:.2f}^2")
print(f"Fitting result: (x^2 + y^2) = {r_fit:.2f}^2")
print(f"Parameter uncertainty: r_err = {r_err:.2f}")

# 信頼区間の計算
nstd = 1.96  # 95% 信頼区間
r_fit_up = r_fit + nstd * r_err
r_fit_dw = r_fit - nstd * r_err

# フィッティング円と信頼区間のプロット
fig, ax = plt.subplots(subplot_kw={'aspect': 'equal'})
plt.errorbar(x_obs, y_obs, xerr=x_err, yerr=y_err, fmt='o', label="Data")

# フィッティング円のパッチを追加
fitted_circle = Circle(
    (0, 0), r_fit,
    edgecolor='red',
    facecolor='none',
    label=f"Fitted: r={r_fit:.2f}"
)
ax.add_patch(fitted_circle)

# 信頼区間のドーナツ状の塗りつぶし
circle_outer = plt.Circle((0, 0), r_fit_up, color='gray', alpha=0.3, label="95% CI")
circle_inner = plt.Circle((0, 0), r_fit_dw, color='white', alpha=1.0)
ax.add_artist(circle_outer)
ax.add_artist(circle_inner)

# 真の円のパッチを追加
true_circle = Circle(
    (0, 0), r_true,
    edgecolor='k',
    facecolor='none',
    linestyle='--',
    label=f"True circle: r={r_true:.2f}"
)
ax.add_patch(true_circle)

plt.xlabel("x")
plt.ylabel("y")
plt.legend()
plt.axis("equal")
plt.title("95% confidence interval")
plt.show()
コードの説明
-
RealDataクラス:x=np.array([x_obs, y_obs])、sx=np.array([x_err, y_err])のように、$x$と$y$の情報をxやsxに入れることがポイントです。また、y=1と指定する理由は戻り値の次元に関係しますが、少し複雑なので詳細は公式ページをご参照ください。yについて公式ページより If y is an integer, then the Data instance can only be used to fit with implicit models where the dimensionality of the response is equal to the specified value of y. -
Modelクラス: 陰関数を使う場合は、implicit=Trueと指定します。
まとめ
本記事では、直交距離回帰(ODR)の手法とPythonによる実装方法について解説しました。この手法は、$x$および$y$の両方に誤差が含まれる回帰分析において特に有効です。Pythonのscipy.odrモジュールを使用すれば、線形モデル、非線形モデル、さらには陰関数モデルの実装も簡単に行えます。ぜひ試してみてください。


